. 2011 Oct;12(5):605-16.
doi: 10.1007/s10162-011-0277-0. Epub 2011 Jun 18.

Primary neural degeneration in the Guinea pig cochlea after reversible noise-induced threshold shift

Affiliations

Primary neural degeneration in the Guinea pig cochlea after reversible noise-induced threshold shift

Harrison W Lin et al. J Assoc Res Otolaryngol. 2011 Oct.

Abstract

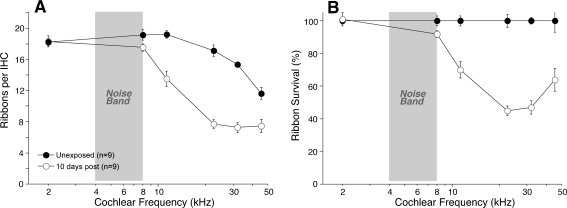
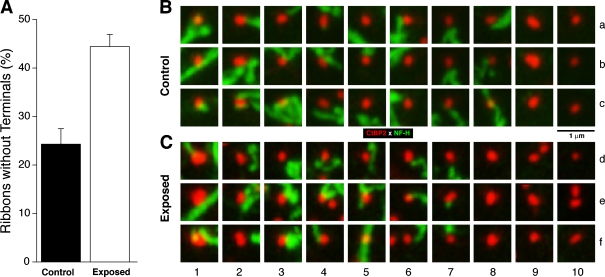
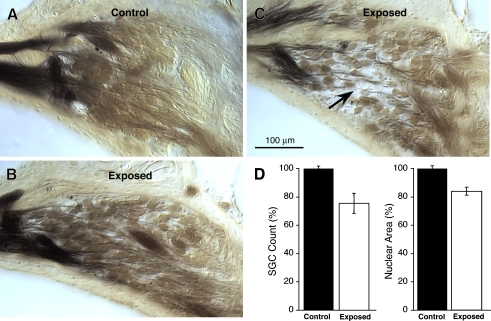
Recent work in mouse showed that acoustic overexposure can produce a rapid and irreversible loss of cochlear nerve peripheral terminals on inner hair cells (IHCs) and a slow degeneration of spiral ganglion cells, despite full recovery of cochlear thresholds and no loss of inner or outer hair cells (Kujawa and Liberman, J Neurosci 29:14077-14085, 2009). This contrasts with earlier ultrastructural work in guinea pig suggesting that acute noise-induced neural degeneration is followed by full regeneration of cochlear nerve terminals in the IHC area (Puel et al., Neuroreport 9:2109-2114, 1998; Pujol and Puel, Ann N Y Acad Sci 884:249-254, 1999). Here, we show that the same patterns of primary neural degeneration reported for mouse are also seen in the noise-exposed guinea pig, when IHC synapses and cochlear nerve terminals are counted 1 week post-exposure in confocal images from immunostained whole mounts and that the same slow degeneration of spiral ganglion cells occurs despite no loss of IHCs and apparent recovery of cochlear thresholds. The data cast doubt on prior claims that there is significant neural regeneration and synaptogenesis in the adult cochlea and suggest that denervation of the inner hair cell is an important sequela of "reversible" noise-induced hearing loss, which likely applies to the human ear as well.


Figures

FIG. 1
FIG. 1
The normal afferent innervation of the inner hair cell (IHC). A Schematic illustrating two of the 15–20 unmyelinated cochlear nerve terminals (green) making synaptic contact with a single IHC. At each synapse, a pre-synaptic ribbon (red) is present within the IHC. When immunostained with anti-CtBP2 (as in Figs. 4 and 6), the IHC nucleus is also stained. The positions of pillar vs. modiolar sides of the IHC are shown. When viewed in the confocal as epithelial whole mounts, the x-, y-, and z-planes are oriented as shown. B An electron micrograph of a synaptic complex illustrating the pre-synaptic ribbon and its halo of synaptic vesicles within the IHC (modified from Liberman 1980).
FIG. 2
FIG. 2
Despite a large initial threshold shift from exposure to octave-band noise (4–8 kHz) at 106 dB, thresholds recover by 10 days post-exposure, as seen via both ABR (A, C) and DPOAE (B, D) measures. Thresholds shown are group means (± SEMs) and are illustrated both as absolute sensitivity (A, B) and as threshold shift re pre-exposure means (C, D). Group sizes are shown in the key. Key in A applies to all panels.
FIG. 3
FIG. 3
Although ABR and DPOAE thresholds return to normal after noise exposure, ABR wave 1 amplitude is significantly reduced (A), whereas DPOAE amplitudes recover fully (B). Data are group means (± SEMs) for five animals tested at 16 kHz before and 2 weeks after exposure to the 4–8 kHz octave-band noise at 106 dB for 2 h (a different group of animals than those shown in Fig. 2). A For each animal, the wave 1 amplitudes (baseline to peak) are normalized, i.e., expressed as a fraction of the pre-exposure amplitude measured in response to 80 dB tones. B DPOAE amplitudes are shown as absolute sound pressure levels. Stimulus level refers to f2; f1 level is always 10 dB greater.
FIG. 4
FIG. 4
Synaptic degeneration in noise-exposed ears is seen as loss, disorganization, and dysmorphology of synaptic ribbons. Confocal images of the IHC area in control (AC) and noise-exposed (DF) ears immunostained for synaptic ribbons (anti-CtBP2, red) and ANF terminals (anti-NF, green; C, F only). The exposed ear was harvested 10 days after the 106-dB octave-band noise. For both ears, images were obtained from the 22-kHz region of the cochlea. A, D Maximum projections in the xy-plane (see Fig. 1) from image stacks focused through the entire synaptic regions of seven to eight adjacent IHCs: Their nuclei stain faintly with anti-CtBP2. Arrowheads in D indicate abnormally large ribbons in the exposed ear. B, E The image stacks from A and D are rotated to view as yz projections, i.e. as a cross section through the sensory epithelium (Fig. 1). A dotted line in B divides “modiolar” and “pillar” sides of the IHCs. C, F Same image stack as B, E, but with the green (anti-NF) channel added. Arrowheads in F indicate abnormally large CtBP2-positive puncta at circumnuclear locations where ANF terminals are not found. Scale bar in C applies to all panels.
FIG. 5
FIG. 5
Quantification of confocal images shows significant loss of synaptic ribbons in the IHC area throughout much of the basal turn in noise-exposed ears. The numbers of ribbons per IHC were counted from confocal z-stacks such as those illustrated in Figure 4. Data are group means (± SEMs) and are shown both as absolute counts (A) and as percent survival (B), computed by dividing the exposed-group numbers by the control group data at the same cochlear frequency region. Group sizes are shown in the key. Key in A also applies to B.
FIG. 6
FIG. 6
Proximity analysis for ANF terminals and synaptic ribbons suggests that ribbon counts underestimate the synaptic degeneration in noise-exposed ears. A Group means (± SEMs) from ribbon analysis in the 22- and 32-kHz regions show that roughly twice as many ribbons from noise-exposed ears are not closely apposed by ANF terminals. Data based on 1,323 ribbons from control ears and 2,432 ribbons from noise-exposed ears. B, C Representative “thumbnail” images on which the analysis in A was based. Each thumbnail shows the xy projection of the voxel space within 1 μm of a ribbon. Ribbons without associated ANF terminals are shown at the right: B9,10 and C8,9,10.
FIG. 7
FIG. 7
Two years after noise exposure, there is modest loss of spiral ganglion cells (SGCs) in the basal turn, when compared to age-matched controls. AC Photomicrographs of cross sections through the spiral ganglion in roughly the 22-kHz region in an age-matched control (A) and in noise-exposed ears from two different animals (B, C), one with barely detectable degeneration (B) and one with the most severe degeneration in any of the ears evaluated (arrow in C). Scale bar in C applies to all three micrographs. D Spiral ganglion cell counts and nuclear areas from the 22-kHz region of three age-matched controls (nine sections) vs. three noise-exposed ears (nine sections) with roughly 2-year post-exposure survival (683 days). Means ± SEM are shown. For both the cell counts and the nuclear areas, data are normalized to the control group means.

References

    1. Costalupes JA, Young ED, Gibson DJ. Effects of continuous noise backgrounds on rate response of auditory nerve fibers in cat. J Neurophysiol. 1984;51:1326–1344. - PubMed
    1. Hakuba N, Koga K, Gyo K, Usami S, Tanaka K. Exacerbation of noise induced hearing loss in mice lacking the glutamate transporter GLAST. J Neurosci. 2000;20:8750–8753. - PMC - PubMed
    1. Hashimoto S, Kimura RS, Takasaka T. Computer-aided three-dimensional reconstruction of the inner hair cells and their nerve endings in the guinea pig cochlea. Acta Otolaryngol. 1991;109:228–234. doi: 10.3109/00016489009107438. - DOI - PubMed
    1. Kujawa SG, Liberman MC. Adding insult to injury: cochlear nerve degeneration after “temporary” noise-induced hearing loss. J Neurosci. 2009;29:14077–14085. doi: 10.1523/JNEUROSCI.2845-09.2009. - DOI - PMC - PubMed
    1. Liberman MC. Auditory-nerve response from cats raised in a low-noise chamber. J Acoust Soc Am. 1978;63:442–455. doi: 10.1121/1.381736. - DOI - PubMed

Publication types