. 2011 Jun 20:6:29.
doi: 10.1186/1749-8104-6-29.

Temporal-spatial changes in Sonic Hedgehog expression and signaling reveal different potentials of ventral mesencephalic progenitors to populate distinct ventral midbrain nuclei

Affiliations

Temporal-spatial changes in Sonic Hedgehog expression and signaling reveal different potentials of ventral mesencephalic progenitors to populate distinct ventral midbrain nuclei

Sandra Blaess et al. Neural Dev. .

Abstract

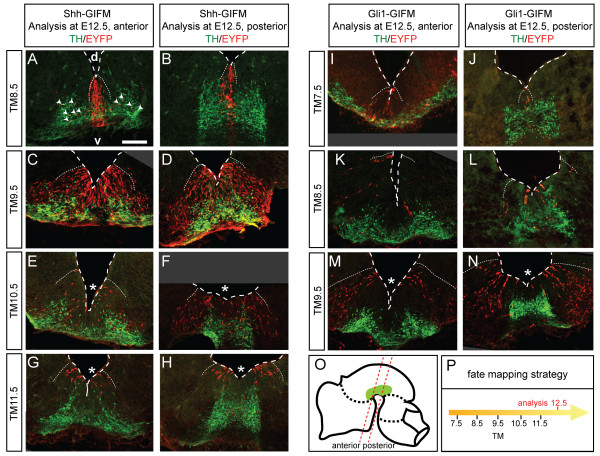
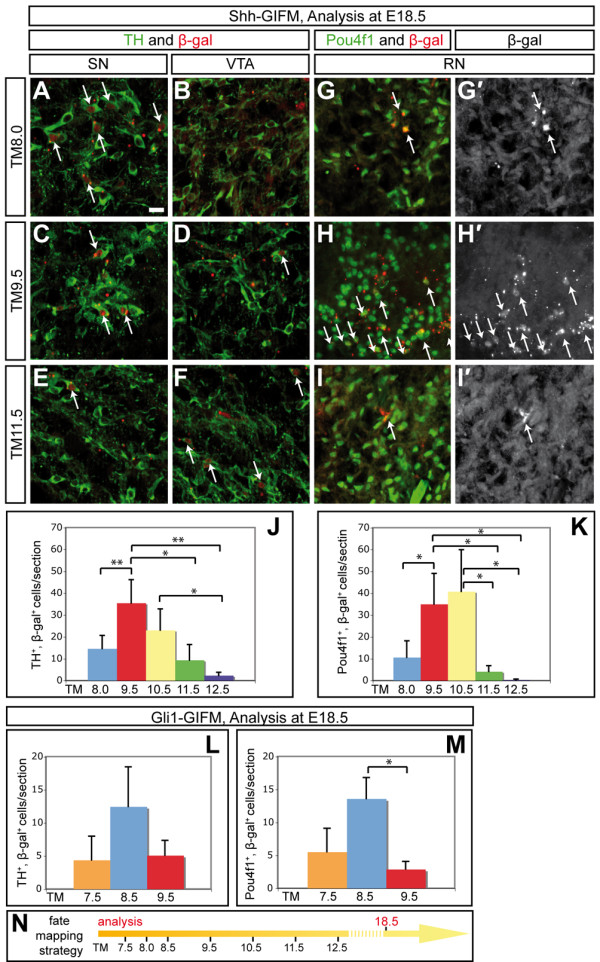
Background: The ventral midbrain contains a diverse array of neurons, including dopaminergic neurons of the ventral tegmental area (VTA) and substantia nigra (SN) and neurons of the red nucleus (RN). Dopaminergic and RN neurons have been shown to arise from ventral mesencephalic precursors that express Sonic Hedgehog (Shh). However, Shh expression, which is initially confined to the mesencephalic ventral midline, expands laterally and is then downregulated in the ventral midline. In contrast, expression of the Hedgehog target gene Gli1 initiates in the ventral midline prior to Shh expression, but after the onset of Shh expression it is expressed in precursors lateral to Shh-positive cells. Given these dynamic gene expression patterns, Shh and Gli1 expression could delineate different progenitor populations at distinct embryonic time points.

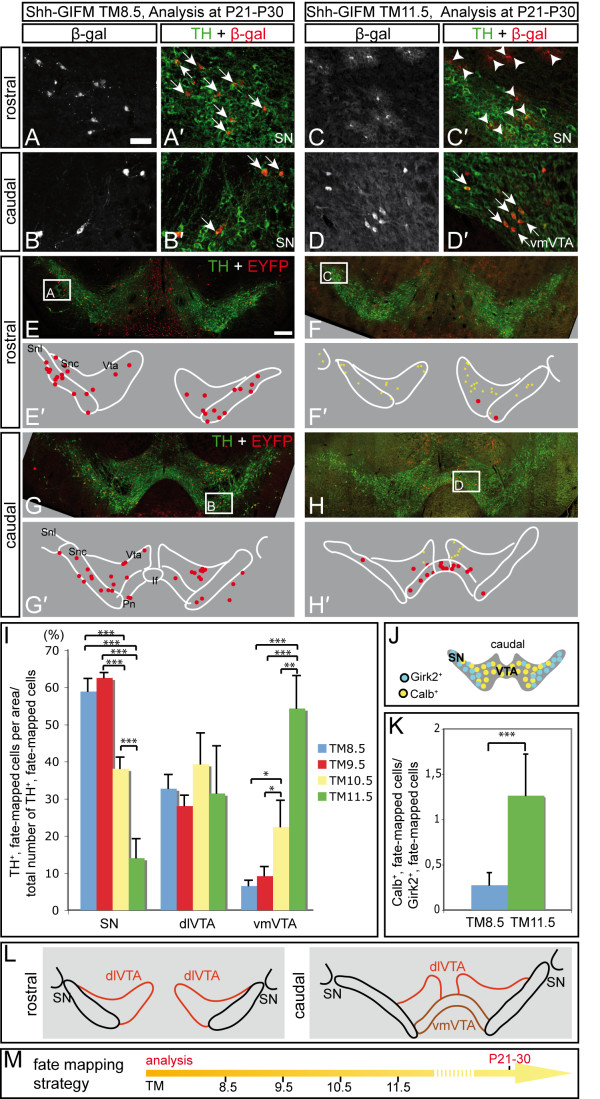
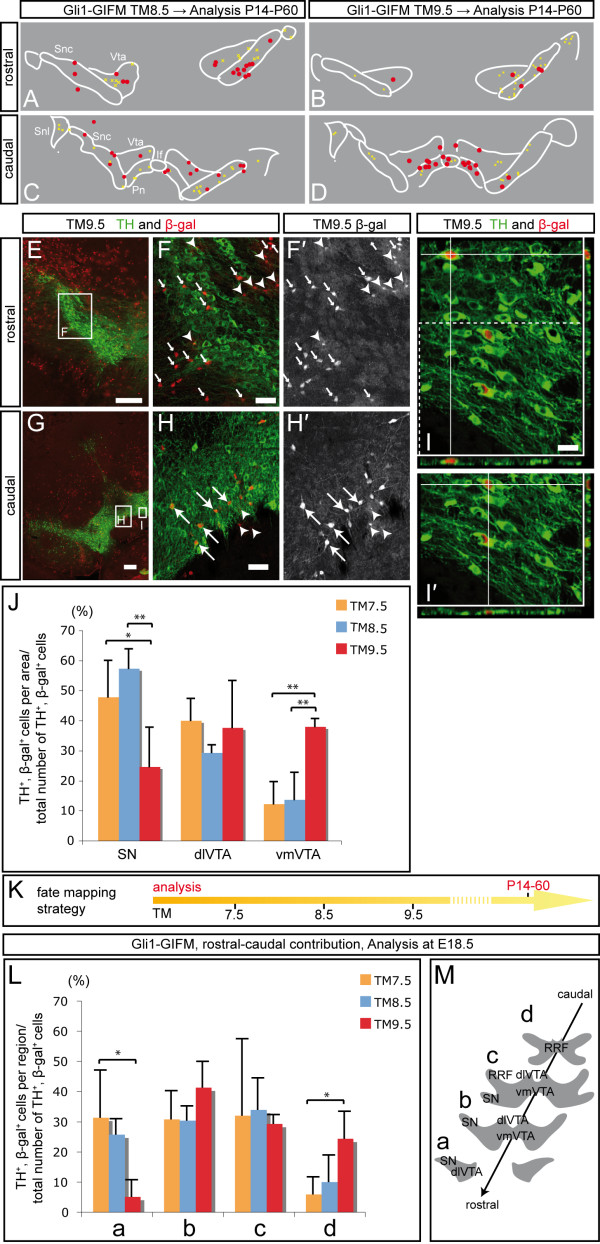
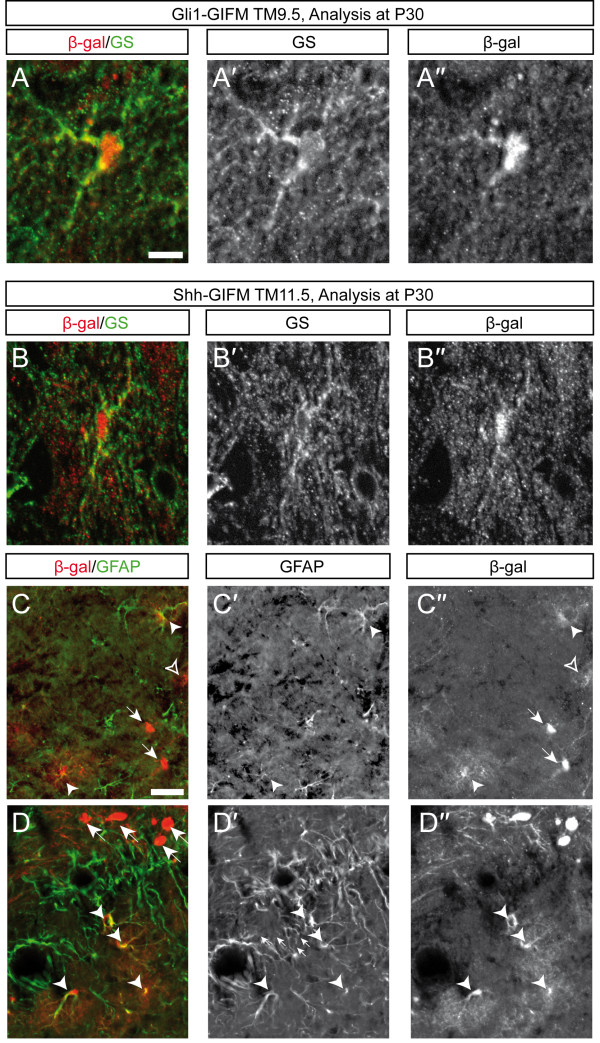
Results: We employed genetic inducible fate mapping (GIFM) to investigate whether precursors that express Shh (Shh-GIFM) or transduce Shh signaling (Gli1-GIFM) at different time points give rise to different ventral midbrain cell types. We find that precursors restricted to the ventral midline are labeled at embryonic day (E)7.5 with Gli1-GIFM, and with Shh-GIFM at E8.5. These precursors give rise to all subtypes of midbrain dopaminergic neurons and the anterior RN. A broader domain of progenitors that includes the ventral midline is marked with Gli1-GIFM at E8.5 and with Shh-GIFM at E9.5; these fate-mapped cells also contribute to all midbrain dopaminergic subtypes and to the entire RN. In contrast, a lateral progenitor domain that is labeled with Gli1-GIFM at E9.5 and with Shh-GIFM at E11.5 has a markedly reduced potential to give rise to the RN and to SN dopaminergic neurons, and preferentially gives rise to the ventral-medial VTA. In addition, cells derived from Shh- and Gli1-expressing progenitors located outside of the ventral midline give rise to astrocytes.

Conclusions: We define a ventral midbrain precursor map based on the timing of Gli1 and Shh expression, and suggest that the diversity of midbrain dopaminergic neurons is at least partially determined during their precursor stage when their medial-lateral position, differential gene expression and the time when they leave the ventricular zone influence their fate decisions.


Figures

Figure 1
Figure 1
Dynamic changes in Shh and Gli1 expression in the ventral mesencephalic neural tube. RNA in situ hybridization with Shh, Gli1 and Lmx1a RNA probes. The analysis was performed on transverse sections (E8.5) or coronal sections of the mesencephalon (mes; E9.5 to E12.5); sections shown are at the level of the intermediate mes. V, ventral; D, dorsal. The mesencephalon is outlined. (A-E) Shh is initially expressed in the notochord (NC) and is induced in the mesencephalon floor plate (FP) at E8.5. Shh expression expands laterally over the subsequent days of development (E9.5 to E12.5), but is downregulated medially (E10.5 to E12.5). (F-J) At all time points analyzed, Gli1 expression, a readout for high levels of Shh signaling, is located laterally to the Shh-expressing cells. Gli1 expression is largely absent in the Shh-expressing domain, indicating that Shh-expressing cells do not respond to high level Shh signaling. At E9.5, the weak ventral expression domain of Gli1 and the weak lateral expression domain of Shh appear to overlap partially (B',G', asterisks), but at later stages, the Shh and Gli1 domains are clearly separated. Note that Gli1 expression is not upregulated in medial cells that downregulate Shh expression. (K-N) Lmx1a is expressed in the DA precursor domain and in differentiating DA neurons. Scale bars: (A,F) 50 μm; (B-E,G-J,K-N) 100 μm.
Figure 2
Figure 2
Initial domains of cells marked with Shh- or Gli1-GIFM in comparison with other ventral midbrain markers. (A-Y) In situ hybridization (A-J) and immunostainings (K-Y) on E10.5 and E12.5 coronal sections for markers of the DA precursor domain (Lmx1a, Msx1, Corin) and the RN precursor domain (Sim1, Nkx6-1). Foxa2 encompasses both precursor domains. Nkx2-2 labels a precursor domain that is thought to give rise to GABAergic interneurons. (K-Y) Shh-GIFM (K-Q') and Gli1-GIFM (R-Y'). TM was administered at the indicated time points and marked cells were analyzed at E10.5 or E12.5 with EYFP (green) and Nkx6-1 or Nkx2-2 (red) immunostaining. The Lmx1a-expressing (yellow or orange dashed line) and the Foxa2-expressing (blue dashed lines) cells are outlined in some sections. Arrows indicate double-labeled cells, arrowheads in X' and Y' indicate fate-mapped cells in the Nkx6-1 negative medial domain. The medial-lateral extent of the initial fate-mapped domains reflects the endogenous gene expression around the time of TM administration (compare with Figure 1). Note that the labeling is mosaic, since only a subset of cells is recombined in a given domain. Panels (L'-Y') are higher magnifications of the areas indicated with the dashed box in (L-Y). (Z) Distribution of cells fate-mapped at the indicated time points. The summary is based on the immunostainings and in situ hybridizations at E10.5 and E12.5. To assess the distribution of the fate-mapped cells, at least three sections were analyzed for each TM time point at E10.5 and E12.5. To determine the expression domains of the specific transcription factors, sections from at least three embryos were analyzed. Scale bars: 100 μm.
Figure 3
Figure 3
Changing populations of precursors are marked with Shh- and Gli1-GIFM at different stages of development. (A-N) Immunofluorescent staining for DA neurons (TH, green) and EYFP-positive fate-mapped cells (red) on E12.5 coronal sections of the mesencephalon showing the distribution of marked cells in the ventricular zone and their contribution to TH-positive DA neurons. The labeling is mosaic, since only a subset of cells is recombined in a given domain. Asterisks indicate a decreased contribution of marked cells to the medial precursor domain. Arrowheads in (A) indicate TH/EYFP-positive cells that are located more lateral than their precursor domain. The mesencephalon ventricle is outlined. v, ventral; d, dorsal. Note that there is less recombination with Gli1-GIFM (I-N) than with Shh-GIFM (A-K). Scale bar: 100 μm. (O) The representative sections shown in (A-N) are at the level of the anterior and posterior mesencephalon as indicated in the schematic. (P) Schematic of fate mapping strategy.
Figure 4
Figure 4
Progenitors marked with Shh- and Gli1-GIFM give rise to DA and RN neurons over several days of embryonic development. (A-K) Shh-GIFM; (L,M) Gli1-GIFM. (A-F) Immunofluorescent staining for DA neurons (TH, green) and β-gal-positive fate-mapped cells (red) on E18.5 coronal sections. Examples shown are located in the SN or the VTA. Arrows indicate double-labeled cells. Note that there are distinct contributions of marked cells to the SN or VTA at different fate-mapping time points. (G-I') Immunofluorescent staining for RN neurons (Pou4f1, green) and β-gal-positive fate-mapped cells (red) on E18.5 coronal sections. Arrows indicate double-labeled cells. Scale bar: 20 μm. (J-M) Quantification of the contribution of cells marked with Shh- or Gli1-GIFM to DA and RN neurons. Analysis was performed at E18.5. Cells positive for TH and β-gal (J,L) or Pou4f1 and β-gal (K,M) were counted and normalized for the number of counted sections. The peak contribution of cells marked with Shh-GIFM to DA neurons is with TM9.5, and to RN neurons with TM9.5 and TM10.5. These TM time points correlate with the broadest Shh-expressing domain. The peak contributions of cells marked with Gli1-GIFM to DA and RN neurons are one to two days earlier than observed for cells labeled with Shh-GIFM, consistent with medial Gli1 expression preceding Shh expression. Error bars indicate standard deviations; asterisks indicate the P-value as determined by Student's t-test (*P < 0.05; **P < 0.01). (N) Schematic of fate mapping strategy.
Figure 5
Figure 5
Precursors labeled with Shh-GIFM at different time points contribute differentially to different rostral-caudal regions of DA neurons. (A) Representative schematics of sections immunostained for TH and β-gal. β-gal- and TH-expressing cells (dark blue dots) and β-gal-expressing cells negative for TH (dark blue circles) on rostral (region a) and intermediate (region b) coronal sections through the E18.5 ventral midbrain. The DA neuron containing areas are outlined. Early (TM administration at E8.0 (TM8.0) to TM10.5) but not late Shh-GIFM (TM11.5 to TM12.5) results in contribution to the rostral and lateral areas of the SN. Shh-derived cells with TM11.5 contribute primarily to caudal and medial areas of the VTA. dlVTA, dorsal-lateral VTA; vmVTA, ventral-medial VTA. (B) Schematic of the regions used to quantify the contribution of fate-mapped cells to DA neurons in a region-specific manner. RRF, retrorubral field. (C) Relative contribution of Shh-derived cells to different regions of DA neurons along the rostral-caudal axis of the midbrain. For each animal (n ≥ 3), β-gal- and TH-co-expressing cells were counted in four regions along the rostral-caudal axis of the ventral midbrain as indicated in (B) and normalized for the combined number of double-labeled cells counted in the four regions (in percent). Error bars indicate standard deviation. Significance (*P < 0.05; **P < 0.01; ***P < 0.001) was determined by analysis of variance (ANOVA) and least significant difference (LSD) post-hoc analysis.
Figure 6
Figure 6
Cells labeled with Shh-GIFM at different time points have a changing potential to contribute to subpopulations of DA neurons. (A-H) Immunofluorescent staining for β-gal-positive fate-mapped cells (Shh-GIFM at E8.5 or E11.5) and DA neurons (TH) on coronal sections of the ventral midbrain (P21 to P30). The areas shown in (A-D) are indicated in (E-H). Arrows indicate double-labeled cells; arrowheads indicate β-gal-positive cells with astrocytic morphology. (E'-H') Representative schematics of the immunostained sections showing the distribution of TH-positive fate-mapped cells (red dots) and of fate-mapped cells with astrocytic morphology (yellow crosses). Rostral, Bregma -2.92; caudal, Bregma -3.40 [20]. If, interfascicular nucleus; Pn, paranigral nucleus; Snc, substantia nigra pars compacta; Snl, substantia nigra lateralis; Vta, VTA. Fate-mapped cells outside these areas are not represented. Cells with astrocytic morphology are not present with TM8.5. Scale bars: (A-D) 40 μm; (E-H) 200 μm. (I) Relative contribution of cells marked with Shh-GIFM between E8.5 and E11.5 to the SN (Snl + Snc), dorsal-lateral VTA (Vta) and ventral-medial VTA (Pn + If); see schematic in (L). For each animal (n ≥ 3), TH-positive fate-mapped cells were counted in the three indicated areas and normalized for the combined number of overlapping cells counted in these areas (in percent). Error bars indicate standard deviation. Significance (*P < 0.05; **P < 0.01; ***P < 0.001) was determined by ANOVA and LSD post-hoc analysis. (J) Distribution of Calbindin- and Girk2-positive cells. (K) Relative contribution of fate-mapped cells to Calbindin (VTA) versus Girk2 (SN) positive cells. Calbindin- or Girk2-positive fate-mapped cells were counted in three different rostral-caudal midbrain areas (n ≥ 3). The ratio of Calbindin-positive fate-mapped cells to Girk2-positive fate-mapped cells was determined. Significance (***P < 0.001) was determined by Student's t-test. (L) Schematic showing the SN, dlVTA and vmVTA. (M) Fate mapping strategy.
Figure 7
Figure 7
Cells labeled with Gli1-GIFM at different time points have a changing potential to contribute to subpopulations of DA neurons. (A-D) Representative schematics of immunostained sections (P14 to P60) labeled with Gli1-GIFM at E9.5. Red dots, TH-positive fate-mapped cells; yellow crosses, cells with astrocytic morphology. Rostral, Bregma -2.92; caudal, Bregma -3.40 [20]. If, interfascicular nucleus; Pn, paranigral nucleus; Snc, substantia nigra pars compacta; Snl, substantia nigra lateralis; Vta, VTA. (E-I') Immunofluorescent staining for DA neurons (TH, green) and fate-mapped cells (Gli1-GIFM at E9.5; β-gal, red) on coronal midbrain sections. The areas in (F,F'), (H,H') and (I) are indicated in (E) and (G). Big arrows indicate TH- and β-gal-positive cells; arrowheads indicate fate-mapped cells with astrocytic morphology; small arrows indicate β-gal-positive, TH-negative cells with neuronal morphology. (I,I') Z-stacks of optical sections taken with a Zeiss Apotome. (I') Area indicated with dashed box in (I). Scale bars: (E,G) 200 μm; (F,H) 40 μm; (I,I') 20 μm. (J) Relative contribution of cells marked with Gli1-GIFM between E7.5 and E9.5 to the SN, dlVTA and vmVTA; see schematic in Figure 6L. For each animal (n ≥ 3), TH-positive fate-mapped cells were counted in the three indicated areas and normalized for the combined number of overlapping cells counted in these areas (in percent). Error bars indicate standard deviation. Significance (*P < 0.05; **P < 0.01) was determined by ANOVA and LSD post-hoc analysis. (K) Fate mapping strategy. (L) Relative contribution of fate-mapped cells to different rostral-caudal midbrain regions at E18.5. For each animal (n ≥ 3), β-gal- and TH-co-expressing cells were counted in four rostral-caudal midbrain regions (see (M)) and normalized for the combined number of cells counted in the four regions (in percent). Error bars indicate standard deviation. Significance (*P < 0.05; **P < 0.01) was determined by ANOVA and LSD post-hoc analysis. (M) Rostral-caudal areas used to quantify the contribution of fate-mapped cells to DA neurons at E18.5. RRF, retrorubral field.
Figure 8
Figure 8
Fate-mapped cells contribute to midbrain astrocytes. (A-D) Immunostaining for glutamine synthetase (GS) and β-gal (A,B) or GFAP and β-gal (C,D). Sections were imaged using a Zeiss Apotome setup. (A,B) β-gal-positive cells with astrocytic morphology overlap with GS. (C,D) Note that not all β-gal-positive cells with astrocytic morphology express GFAP. Filled arrowheads indicate cells that co-express GFAP; open arrowheads indicate cells that do not express GFAP; arrows highlight cells with a neuronal morphology. Scale bars: (A-B'') 10 μm; (C-D'') 40 μm.

References

    1. Bjorklund A, Dunnett SB. Dopamine neuron systems in the brain: an update. Trends Neurosci. 2007;30:194–202. doi: 10.1016/j.tins.2007.03.006. - DOI - PubMed
    1. Bjorklund A, Dunnett SB. Fifty years of dopamine research. Trends Neurosci. 2007;30:185–187. doi: 10.1016/j.tins.2007.03.004. - DOI - PubMed
    1. Smidt MP, Burbach JP. How to make a mesodiencephalic dopaminergic neuron. Nat Rev Neurosci. 2007;8:21–32. doi: 10.1038/nrn2039. - DOI - PubMed
    1. Dagher A, Robbins TW. Personality, addiction, dopamine: insights from Parkinson's disease. Neuron. 2009;61:502–510. doi: 10.1016/j.neuron.2009.01.031. - DOI - PubMed
    1. Ono Y, Nakatani T, Sakamoto Y, Mizuhara E, Minaki Y, Kumai M, Hamaguchi A, Nishimura M, Inoue Y, Hayashi H, Takahashi J, Imai T. Differences in neurogenic potential in floor plate cells along an anteroposterior location: midbrain dopaminergic neurons originate from mesencephalic floor plate cells. Development. 2007;134:3213–3225. doi: 10.1242/dev.02879. - DOI - PubMed

Publication types

MeSH terms