. 2011 Jun 22;100(12):2904-12.
doi: 10.1016/j.bpj.2011.05.031.

Multiscale modeling of calcium cycling in cardiac ventricular myocyte: macroscopic consequences of microscopic dyadic function

Affiliations

Multiscale modeling of calcium cycling in cardiac ventricular myocyte: macroscopic consequences of microscopic dyadic function

Namit Gaur et al. Biophys J. .

Erratum in

  • Biophys J. 2011 Aug 17;101(4):1014

Abstract

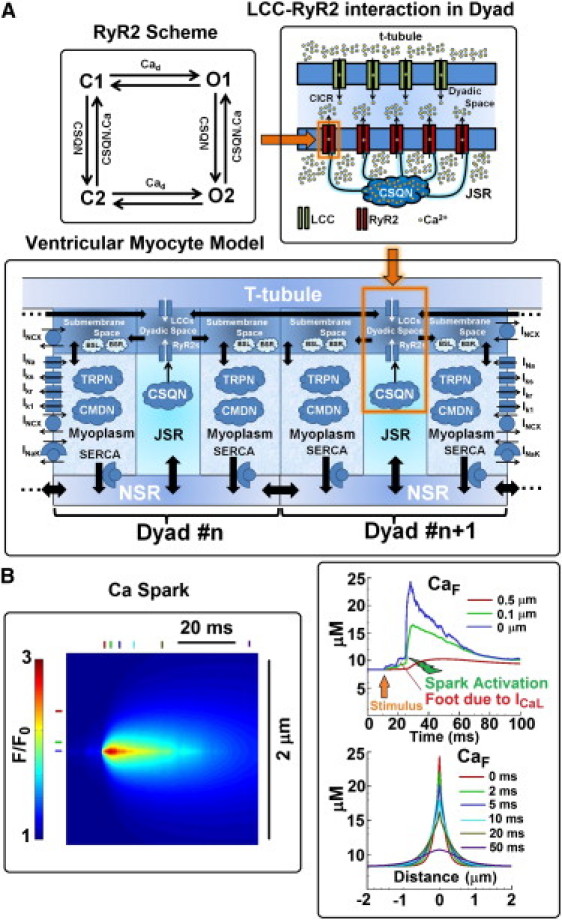
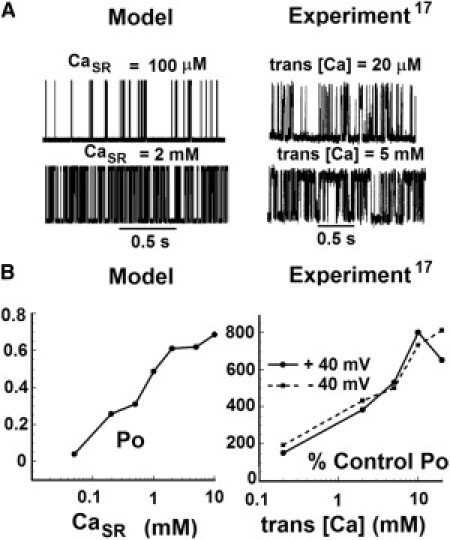
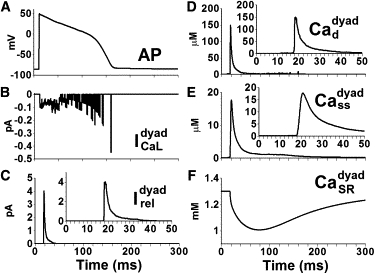
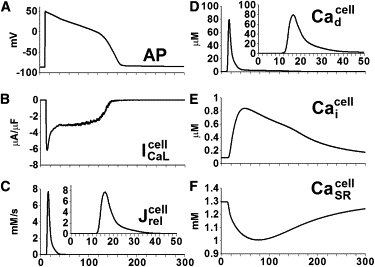
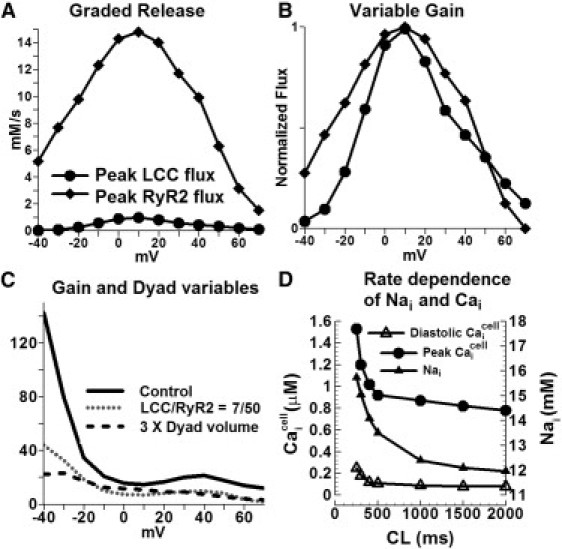
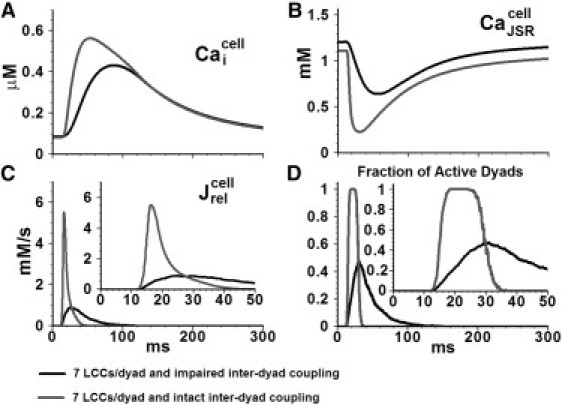
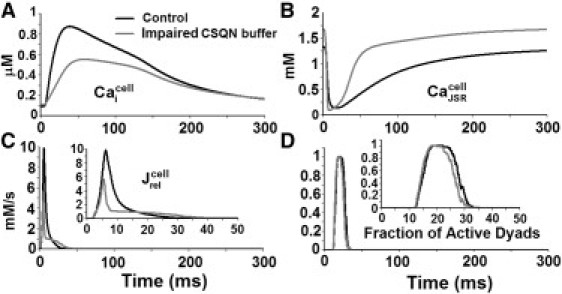
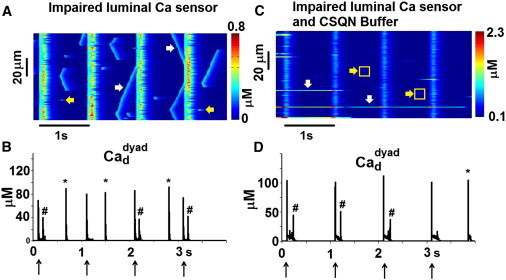
In cardiac ventricular myocytes, calcium (Ca) release occurs at distinct structures (dyads) along t-tubules, where L-type Ca channels (LCCs) appose sarcoplasmic reticulum (SR) Ca release channels (RyR2s). We developed a model of the cardiac ventricular myocyte that simulates local stochastic Ca release processes. At the local Ca release level, the model reproduces Ca spark properties. At the whole-cell level, the model reproduces the action potential, Ca currents, and Ca transients. Changes in microscopic dyadic properties (e.g., during detubulation in heart failure) affect whole-cell behavior in complex ways, which we investigated by simulating changes in the dyadic volume and number of LCCs/RyR2s in the dyad, and effects of calsequestrin (CSQN) as a Ca buffer (CSQN buffer) or a luminal Ca sensor (CSQN regulator). We obtained the following results: 1), Increased dyadic volume and reduced LCCs/RyR2s decrease excitation-contraction coupling gain and cause asynchrony of SR Ca release, and interdyad coupling partially compensates for the reduced synchrony. 2), Impaired CSQN buffer depresses Ca transients without affecting the synchrony of SR Ca release. 3), When CSQN regulator function is impaired, interdyad coupling augments diastolic Ca release activity to form Ca waves and long-lasting Ca release events.


Figures

Figure 1
Figure 1
(A) Schematic diagram of the spatially distributed ventricular myocyte model and its components. The model consists of 10,000 diffusively coupled CaRUs (also called dyads). Each dyad consists of five distinct Ca compartments: NSR, JSR, dyadic space, submembrane space, and myoplasm. Ca concentration is assumed to be uniform in each compartment. The number of LCCs and SR Ca release channels (RyR2s) in a dyad is 15 and 100, respectively, and their states fluctuate stochastically. State diagram of the RyR2 model is shown in the upper-left corner. LCC-RyR2 interaction in a dyad is shown in the upper-right corner. Ca release occurs in the dyadic space. CSQN is a Ca buffer that also regulates RyR2 openings. JSR is defined as the domain of CSQN distribution, so CSQN is in all of JSR. Sarcolemmal buffers (BSL) and SR buffers (BSR) are in the submembrane space. Calmodulin (CMDN) and troponin (TRPN) are Ca buffers in the myoplasm. All Ca-dependent membrane currents, pumps, and exchangers sense Ca concentration in the compartment in which they reside. Important currents that determine membrane potential are shown. Diffusive Ca fluxes are indicated by solid thick arrows. Equations for the model are given in the Supporting Material. The model code is available to download from the research section of http://rudylab.wustl.edu. (B) Left: Simulated Ca spark (line scan); CaF indicates the concentration of Ca-bound Fluo-3 dye. Top right: Temporal profile of CaF at three different locations: the spark center (blue), 0.1 μm from spark center (green), and 0.5 μm from spark center (red). Bottom right: Spatial profile of Ca spark at several time points after initiation. It is assumed that the line scan passes through the spark origin.
Figure 2
Figure 2
RyR2 model response. (A) Simulated (left) and experimentally measured (right) single-channel current records of RyR2 in response to Ca. In the model, the dyadic space Ca (Cad) is held at 15 μM and records are shown for two different SR Ca (CaSR) values: 100 μM and 2 mM. In experiments, cis [Ca] is held at 1 μM and traces are shown for two different trans [Ca] values: 20 μM and 5 mM (reproduced with permission from Györke and Györke (17)). (B) The Po of RyR2 as a function of CaSR at 15 μM Cad. In the simulation (left), Po represents the absolute open probability. In the experiments (right), Po is plotted relative to control conditions at 20 μM trans [Ca] and 1 μM cis [Ca]. The solid line indicates a +40 mV voltage difference between the cis and trans (cistrans) compartments of the lipid bilayer. The dashed line indicates a voltage difference of −40 mV.
Figure 3
Figure 3
Ca currents and Ca concentrations in a single dyad in a ventricular myocyte model paced at 1 Hz. (A) AP. (B) L-type Ca current (ICaLdyad). (C) Ca release current (Ireldyad). (D) Dyadic space Ca concentration (Caddyad). (E) Submembrane Ca concentration (Cassdyad). (F) Free SR Ca concentration (CaSRdyad). Insets in C–E show expanded timescale.
Figure 4
Figure 4
Whole-cell Ca currents and Ca concentrations in the ventricular myocyte model paced at 1 Hz. (A) AP. (B) L-type Ca current (ICaLcell). (C) Ca release flux from SR (Jrelcell). (D) Average Ca concentration in the dyadic space (Cadcell). (E) CaT in the myoplasm (Caicell). (F) Average free Ca concentration in the SR (CaSRcell). Insets in C and D show expanded timescale.
Figure 5
Figure 5
Graded release, variable gain, effect of dyad properties on ECC, and rate dependence of myoplasmic Nai and Cai. (A) Peak LCC Ca flux and peak Ca release flux as a function of transmembrane voltage. (B) Normalized peak LCC Ca flux and peak Ca release flux. (C) ECC gain for three conditions: 1), control (100/15 RyR2/LCC ratio, 2 × 10−19 L dyadic volume); 2), 50/7 RyR2/LCC ratio, 2 × 10−19 L dyadic volume; and 3), 100/15 RyR2/LCC ratio, 6 × 10−19 L dyadic volume. Initial conditions were those of a paced myocyte at 1 Hz. After 5 ms the cell was clamped at the voltage indicated on the x axis. (D) Myoplasmic Nai and Cai rate dependence. Steady-state (after 1000 beats of pacing) Nai, peak Cai and diastolic Cai as a function of cycle length (CL).
Figure 6
Figure 6
Effect of changing the number of functional RyR2s and LCCs in the dyad on whole-cell behavior. (A) Myoplasmic CaT (Caicell). (B) L-type Ca current (ICaLcell). (C) Total SR Ca content. (D) Fraction of active dyads.
Figure 7
Figure 7
Effect of impaired interdyad coupling on whole-cell behavior. (A) Myoplasmic CaT (Caicell). (B) JSR Ca concentration (CaJSRcell). (C) Ca release flux (Jrelcell). (D) Fraction of active dyads. The myocyte model is paced at 1 Hz. Insets show Jrelcell and the fraction of active dyads on an expanded timescale.
Figure 8
Figure 8
Effect of impaired CSQN buffering capacity on whole-cell behavior. (A) Myoplasmic CaT (Caicell). (B) JSR Ca concentration (CaJSRcell). (C) Ca release flux (Jrelcell). (D) Fraction of active dyads. The myocyte model is paced at 1 Hz. Insets show Jrelcell and the fraction of active dyads on an expanded timescale.
Figure 9
Figure 9
Effect of impaired luminal Ca sensor function on whole-cell behavior. (A and B) CSQN buffer is intact. (C and D) CSQN buffer is impaired. (A and C) Line-scan image of Caidyad. (B and D) Dyadic space Ca concentration (Caddyad) in one of the dyads. Arrows at the bottom of panels B and D indicate pacing stimuli. Spontaneous diastolic Ca release events in the form of Ca sparks (yellow arrows) and waves (white arrows) are seen in panel A. Long-lasting Ca release events in a few dyads (white arrows) and dim Ca sparks (yellow arrows) are seen in panel C. The dyad reactivates during the paced AP (#) and spontaneously activates during diastole () in panels B and D.

References

    1. Franzini-Armstrong C., Protasi F., Tijskens P. The assembly of calcium release units in cardiac muscle. Ann. N. Y. Acad. Sci. 2005;1047:76–85. - PubMed
    1. Fabiato A. Time and calcium dependence of activation and inactivation of calcium-induced release of calcium from the sarcoplasmic reticulum of a skinned canine cardiac Purkinje cell. J. Gen. Physiol. 1985;85:247–289. - PMC - PubMed
    1. Cheng H., Lederer W.J., Cannell M.B. Calcium sparks: elementary events underlying excitation-contraction coupling in heart muscle. Science. 1993;262:740–744. - PubMed
    1. Soeller C., Cannell M.B. Examination of the transverse tubular system in living cardiac rat myocytes by 2-photon microscopy and digital image-processing techniques. Circ. Res. 1999;84:266–275. - PubMed
    1. Cheng H., Cannell M.B., Lederer W.J. Propagation of excitation-contraction coupling into ventricular myocytes. Pflugers Arch. 1994;428:415–417. - PubMed

Publication types

MeSH terms