

Transmembrane signaling of chemotaxis receptor tar: insights from molecular dynamics simulation studies
- PMID: 21689529
- PMCID: PMC3123975
- DOI: 10.1016/j.bpj.2011.05.030
Transmembrane signaling of chemotaxis receptor tar: insights from molecular dynamics simulation studies
Abstract
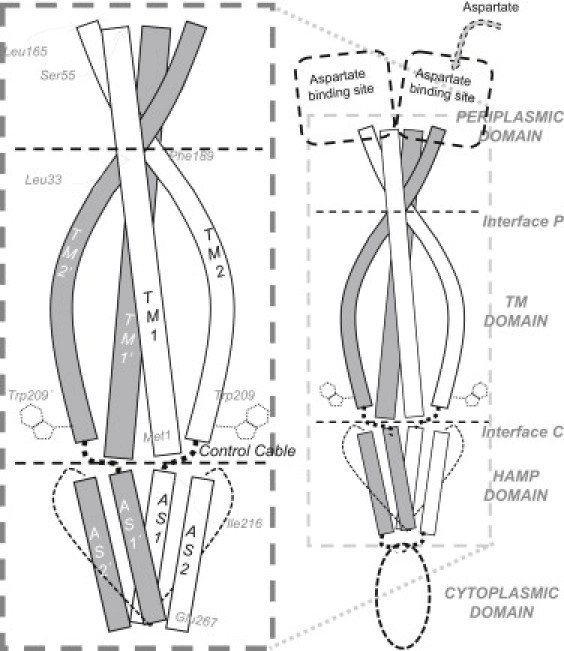
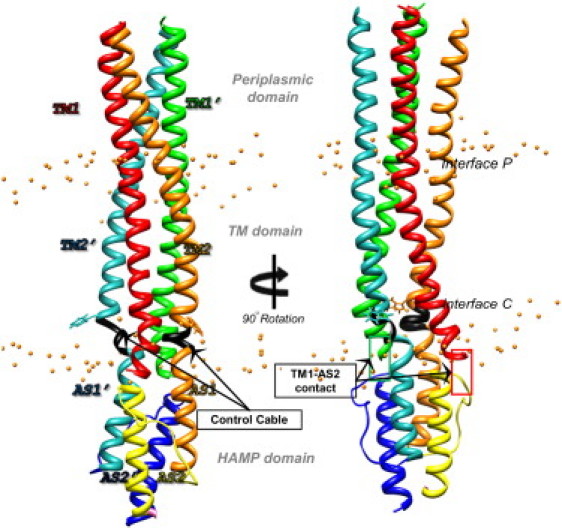
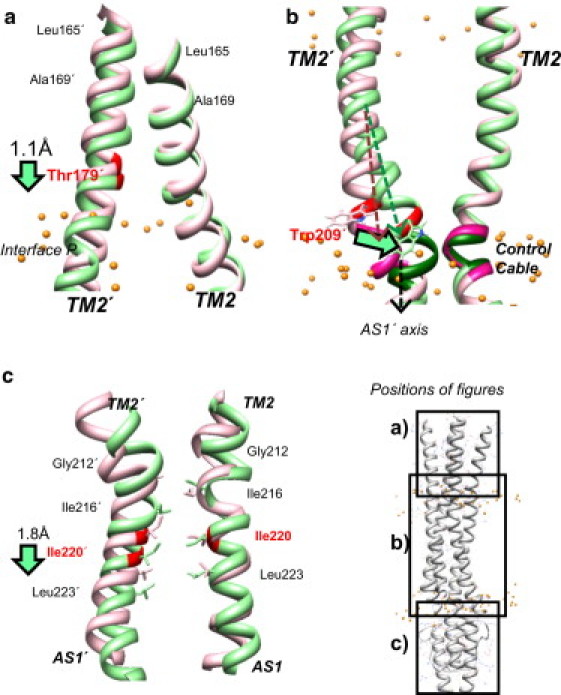
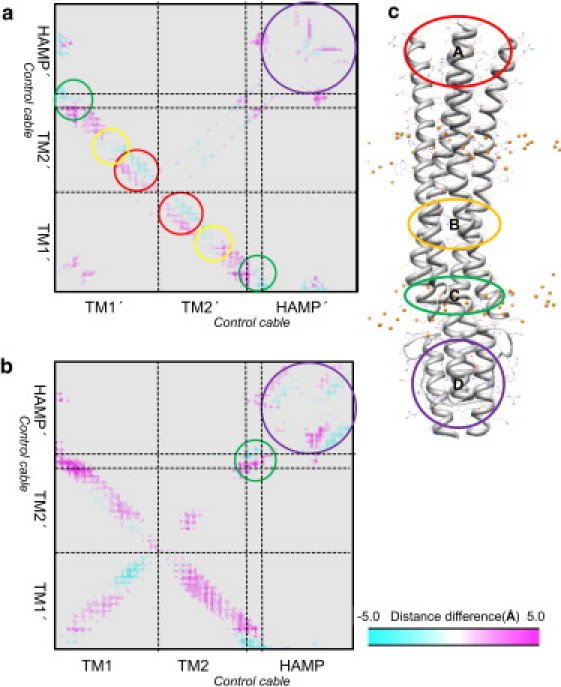
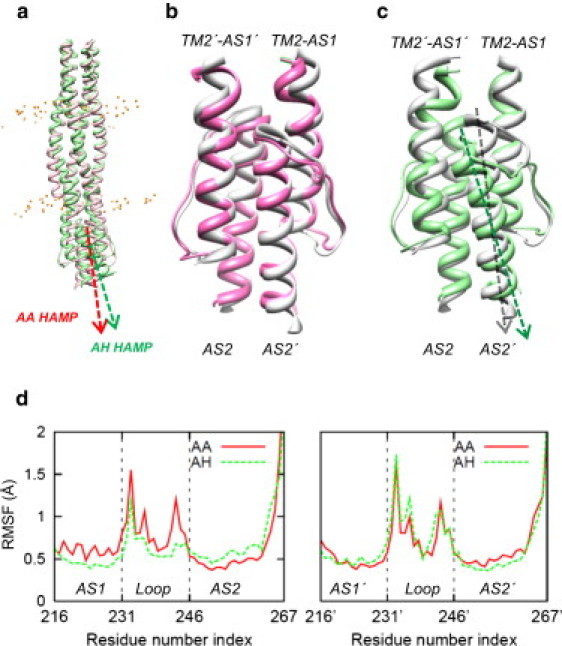
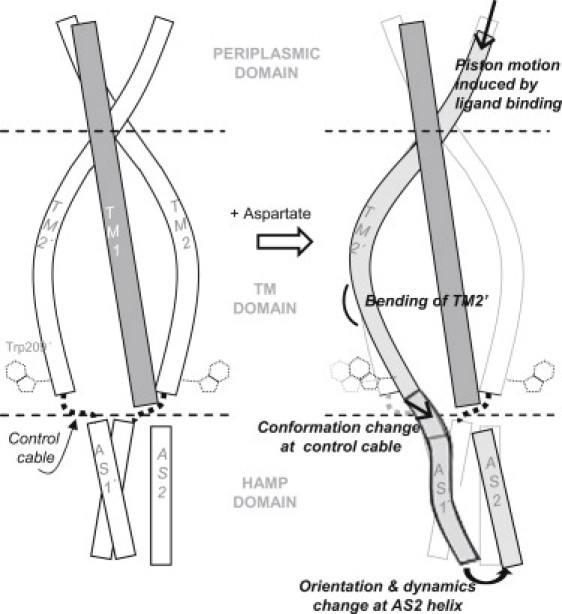
Transmembrane signaling of chemotaxis receptors has long been studied, but how the conformational change induced by ligand binding is transmitted across the bilayer membrane is still elusive at the molecular level. To tackle this problem, we carried out a total of 600-ns comparative molecular dynamics simulations (including model-building simulations) of the chemotaxis aspartate receptor Tar (a part of the periplasmic domain/transmembrane domain/HAMP domain) in explicit lipid bilayers. These simulations reveal valuable insights into the mechanistic picture of Tar transmembrane signaling. The piston-like movement of a transmembrane helix induced by ligand binding on the periplasmic side is transformed into a combination of both longitudinal and transversal movements of the helix on the cytoplasmic side as a result of different protein-lipid interactions in the ligand-off and ligand-on states of the receptor. This conformational change alters the dynamics and conformation of the HAMP domain, which is presumably a mechanism to deliver the signal from the transmembrane domain to the cytoplasmic domain. The current results are consistent with the previously suggested dynamic bundle model in which the HAMP dynamics change is a key to the signaling. The simulations provide further insights into the conformational changes relevant to the HAMP dynamics changes in atomic detail.
Copyright © 2011 Biophysical Society. Published by Elsevier Inc. All rights reserved.
Figures
Similar articles
-
Lock on/off disulfides identify the transmembrane signaling helix of the aspartate receptor.J Biol Chem. 1995 Oct 13;270(41):24043-53. doi: 10.1074/jbc.270.41.24043. J Biol Chem. 1995. PMID: 7592603 Free PMC article.
-
A piston model for transmembrane signaling of the aspartate receptor.Science. 1999 Sep 10;285(5434):1751-4. doi: 10.1126/science.285.5434.1751. Science. 1999. PMID: 10481014
-
Side chains at the membrane-water interface modulate the signaling state of a transmembrane receptor.Biochemistry. 2004 Feb 24;43(7):1763-70. doi: 10.1021/bi0360206. Biochemistry. 2004. PMID: 14967017 Free PMC article.
-
"Frozen" dynamic dimer model for transmembrane signaling in bacterial chemotaxis receptors.Protein Sci. 1994 Feb;3(2):159-65. doi: 10.1002/pro.5560030201. Protein Sci. 1994. PMID: 8003953 Free PMC article. Review.
-
Transmembrane signaling in bacterial chemoreceptors.Trends Biochem Sci. 2001 Apr;26(4):257-65. doi: 10.1016/s0968-0004(00)01770-9. Trends Biochem Sci. 2001. PMID: 11295559 Free PMC article. Review.
Cited by
-
Forcing the issue: aromatic tuning facilitates stimulus-independent modulation of a two-component signaling circuit.ACS Synth Biol. 2015 Apr 17;4(4):474-81. doi: 10.1021/sb500261t. Epub 2014 Sep 9. ACS Synth Biol. 2015. PMID: 25162177 Free PMC article.
-
The HAMP signal relay domain adopts multiple conformational states through collective piston and tilt motions.PLoS Comput Biol. 2013;9(2):e1002913. doi: 10.1371/journal.pcbi.1002913. Epub 2013 Feb 28. PLoS Comput Biol. 2013. PMID: 23468603 Free PMC article.
-
Mechanisms of E. coli chemotaxis signaling pathways visualized using cryoET and computational approaches.Biochem Soc Trans. 2022 Dec 16;50(6):1595-1605. doi: 10.1042/BST20220191. Biochem Soc Trans. 2022. PMID: 36421737 Free PMC article. Review.
-
A phenylalanine rotameric switch for signal-state control in bacterial chemoreceptors.Nat Commun. 2013;4:2881. doi: 10.1038/ncomms3881. Nat Commun. 2013. PMID: 24335957 Free PMC article.
-
Methyl-accepting chemotaxis proteins: a core sensing element in prokaryotes and archaea.Cell Mol Life Sci. 2017 Sep;74(18):3293-3303. doi: 10.1007/s00018-017-2514-0. Epub 2017 Apr 13. Cell Mol Life Sci. 2017. PMID: 28409190 Free PMC article. Review.
References
-
- Parkinson J.S. Signaling mechanisms of HAMP domains in chemoreceptors and sensor kinases. Annu. Rev. Microbiol. 2010;64:101–122. - PubMed
-
- Blair D.F. How bacteria sense and swim. Annu. Rev. Microbiol. 1995;49:489–522. - PubMed
-
- Baker M.D., Wolanin P.M., Stock J.B. Signal transduction in bacterial chemotaxis. Bioessays. 2006;28:9–22. - PubMed
-
- Murphy O.J., 3rd, Kovacs F.A., Thompson L.K. Site-directed solid-state NMR measurement of a ligand-induced conformational change in the serine bacterial chemoreceptor. Biochemistry. 2001;40:1358–1366. - PubMed
Publication types
MeSH terms
Substances
Grants and funding
LinkOut - more resources
Full Text Sources
Miscellaneous
