. 2011 Jun 23;70(6):1143-54.
doi: 10.1016/j.neuron.2011.04.024.

Prestin-driven cochlear amplification is not limited by the outer hair cell membrane time constant

Affiliations

Prestin-driven cochlear amplification is not limited by the outer hair cell membrane time constant

Stuart L Johnson et al. Neuron. .

Abstract

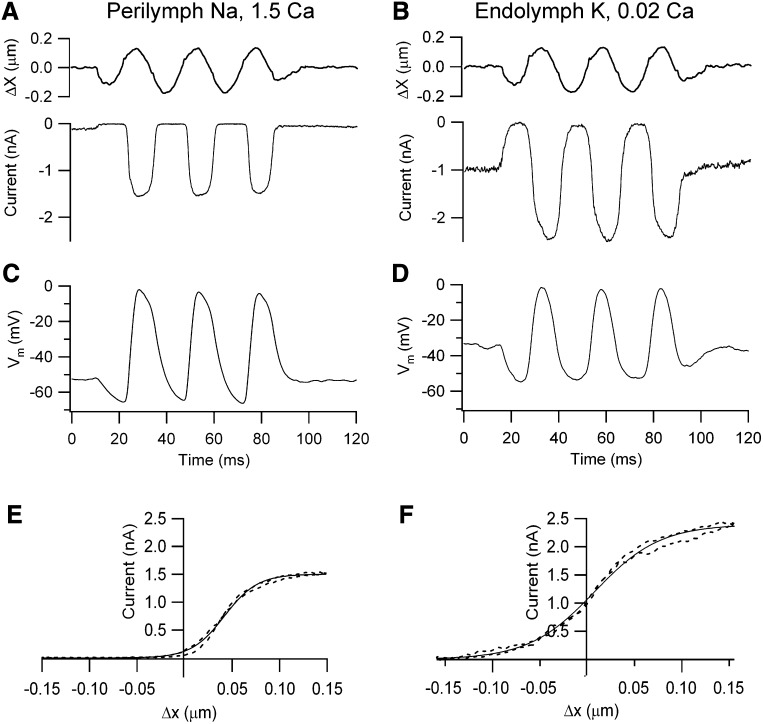
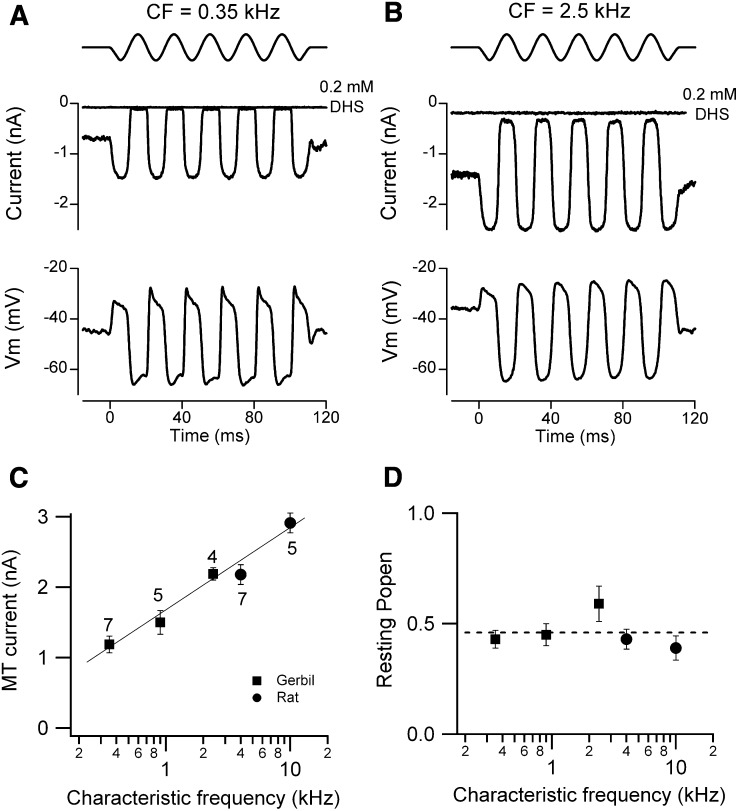
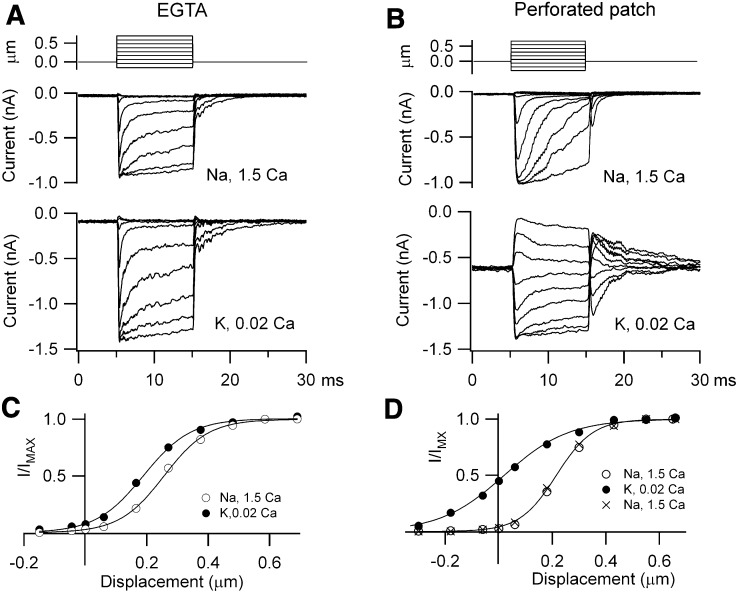
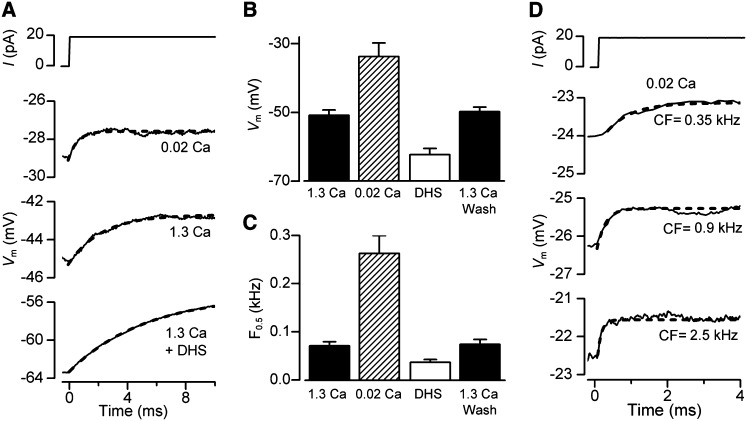
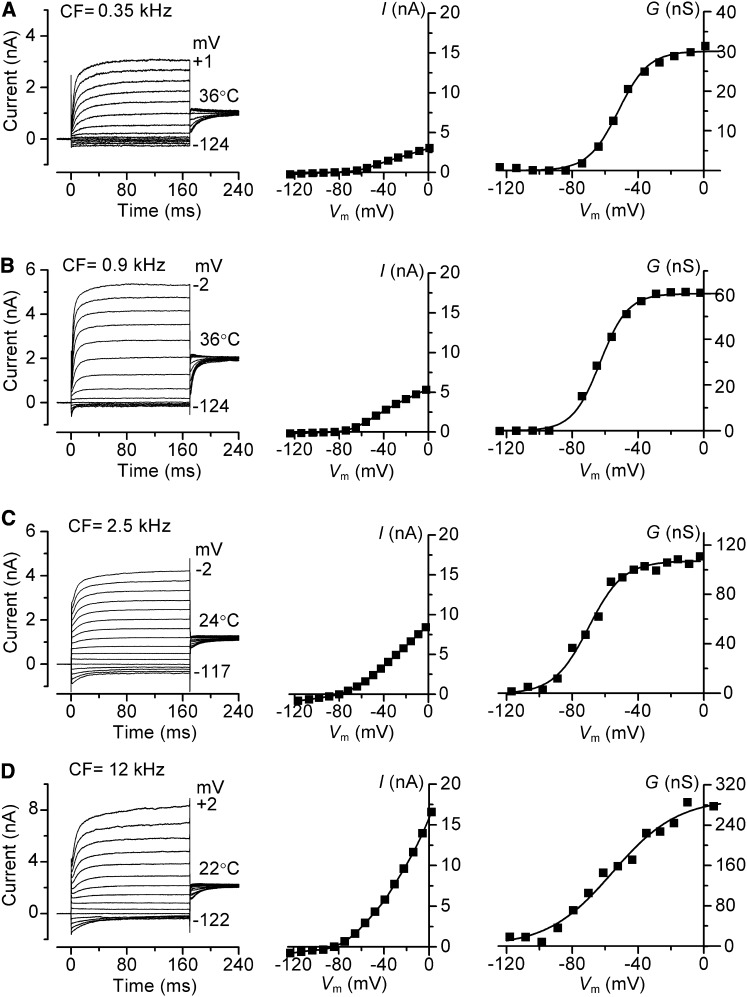
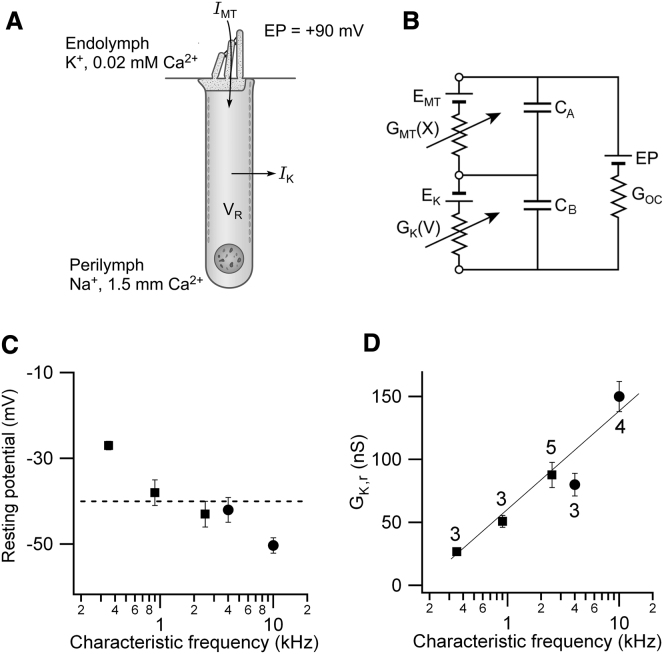
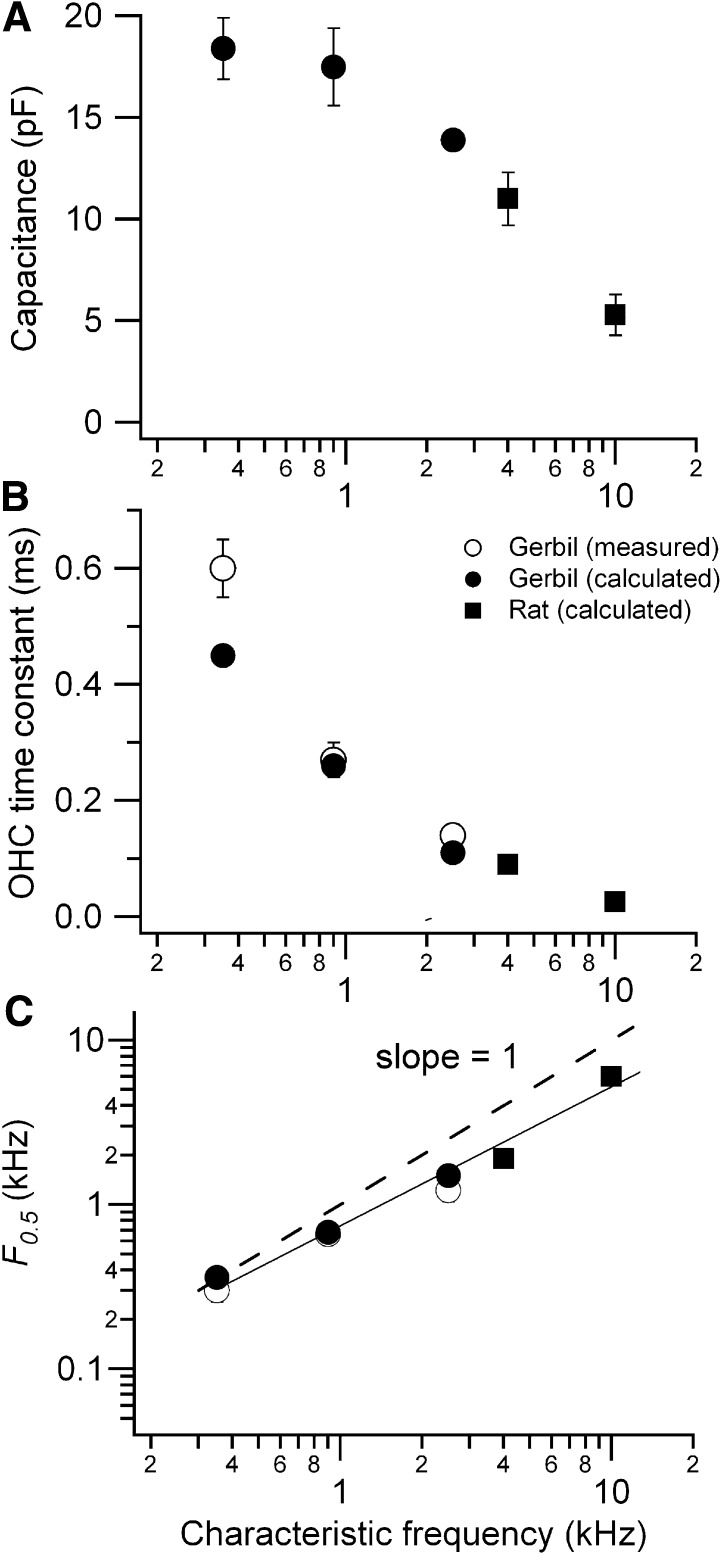
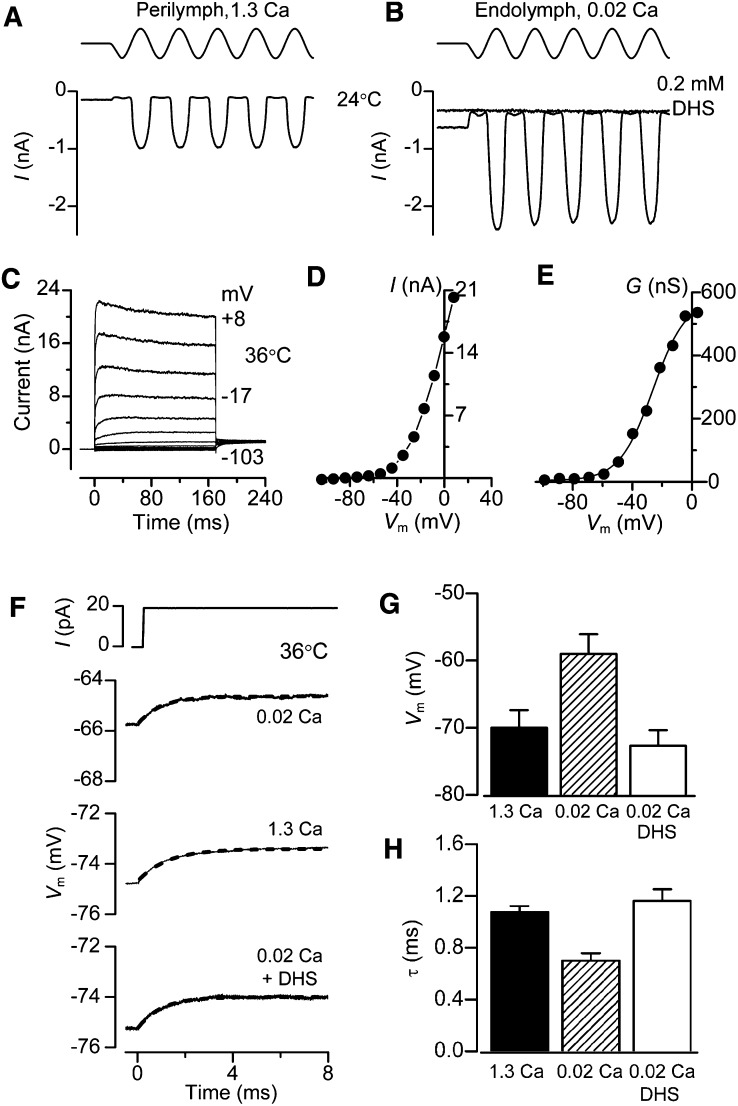
Outer hair cells (OHCs) provide amplification in the mammalian cochlea using somatic force generation underpinned by voltage-dependent conformational changes of the motor protein prestin. However, prestin must be gated by changes in membrane potential on a cycle-by-cycle basis and the periodic component of the receptor potential may be greatly attenuated by low-pass filtering due to the OHC time constant (τ(m)), questioning the functional relevance of this mechanism. Here, we measured τ(m) from OHCs with a range of characteristic frequencies (CF) and found that, at physiological endolymphatic calcium concentrations, approximately half of the mechanotransducer (MT) channels are opened at rest, depolarizing the membrane potential to near -40 mV. The depolarized resting potential activates a voltage-dependent K+ conductance, thus minimizing τ(m) and expanding the membrane filter so there is little receptor potential attenuation at the cell's CF. These data suggest that minimal τ(m) filtering in vivo ensures optimal activation of prestin.


Figures

Figure 1
Figure 1
MT Currents and Receptor Potentials in Rat OHCs (A) Saturating receptor currents with hair bundles exposed to saline containing Na+ and 1.5 mM Ca2+. (B) Saturating receptor currents in a different OHC with hair bundles locally perfused with artificial endolymph containing K+ and 0.02 mM Ca2+. Note larger MT current amplitude and increased fraction on at rest compared to 1.5 mM Ca2+. (C) Receptor potentials, Vm, for cell in (A) with hair bundles exposed to Na+, 1.5 mM Ca2+ saline. (D) Receptor potentials for cell in (B) with hair bundles exposed K+, 0.02 mM Ca2+ endolymph. The sinusoidal stimulus (top), which applies to both receptor currents and potentials, was delivered with a fluid jet, hair bundle motion being calibrated by projection on a photodiode pair; holding potential in voltage clamp −84 mV. (E) Relation between MT current (I) and bundle displacement (X) in (A) over one cycle of the response (dashed line). (F) MT current versus bundle displacement in (B) over one cycle of the response (dashed line). I–X results fitted with single Boltzmann (continuous line): I = IMAX/(1 + (exp((X1 − X)/Xe)) where IMAX = 1.51 nA, Xe = 0.017 μm, X1 = 0.04 μm (C, perilymph); IMAX = 2.4 nA, Xe = 0.035 μm, X1 = 0.008 μm (D, endolymph). Apical cochlear location, P8 (A and C), P9 (B and D) rats, T = 22°C.
Figure 2
Figure 2
Tonotopic Variation in MT Currents with Hair Bundles Exposed to Endolymph (0.02 mM) Ca2+ (A) Saturating MT currents and receptor potentials in an apical gerbil OHC (CF = 0.35 kHz). (B) Saturating MT currents and receptor potentials in a gerbil middle turn OHC (CF = 2.5 kHz). In both (A) and (B), about half the maximum MT current was activated at rest and the current was abolished by addition of 0.2 mM DHS. Top traces show driving voltage to piezo. (C) MT current (mean ± SEM) versus CF for three gerbil locations (filled squares) and two rat locations (filled circles), number of measurements indicated by each point. (D) Resting open probability (Popen; mean ± SEM) of the MT channels for gerbil and rat locations (P7–P10 animals). Currents recorded at −84 mV holding potential, T = 22°C–24°C.
Figure 3
Figure 3
OHC Endogenous Ca2+ Buffer Assayed with Perforated Patch (A) MT currents recorded with an intracellular solution containing 1 mM EGTA as the Ca2+ buffer, in Na+, 1.5 mM Ca2+ saline (middle), and during local perfusion with K+, 0.02 mM Ca2+ endolymph (bottom). (B) MT currents under perforated-patch in Na+, 1.5 mM Ca2+ (middle) and during local perfusion with K+, 0.02 mM Ca2+ endolymph (bottom). Top traces are the bundle stimuli evoked by a piezoelectric-driven glass probe. (C) MT current, I, scaled to its maximum value IMAX, versus hair bundle displacement for recording with EGTA. IMAX = 0.90 nA (1.5 Ca2+) and 1.45 nA (0.02 Ca2+). (D) I/IMAX, versus hair bundle displacement for perforated patch recording. IMAX = 0.99 nA (1.5 Ca2+) and 1.38 nA (0.02 Ca2+) and 0.62 nA (1.5 Ca2+ wash). For both conditions, low Ca2+ endolymph increased the fraction of MT current on at rest, but this was much smaller with EGTA (0.08) than with perforated patch (0.43).
Figure 4
Figure 4
Resting Potentials and Membrane Time Constants (τm) in Gerbil OHCs (A) Voltage responses to current steps in an apical OHC with the hair bundle exposed to 1.3 mM Ca2+, 0.02 mM Ca2+, and 0.2 mM DHS + 1.3 mM Ca2+. Note low Ca2+ depolarizes the OHC and reduces τm. Blocking MT channels with DHS hyperpolarizes the OHC and increases τm. τm was obtained by fitting voltage onsets (dashed lines) with: V = A(1 − exp (−t/τm)), where τm = 2.3 ms (1.3 Ca2+), 0.6 ms (0.02 Ca2+), 5.3 ms (1.3 Ca2+ + DHS). (B) Collected resting potentials (mean ± SEM) from apical OHCs with bundles exposed to 1.3 mM Ca2+ (control, n = 15; wash, n = 14), 0.02 mM Ca2+ (n = 5), and 0.2 mM DHS + 1.3 mM or 0.02 mM Ca2+ (n = 9). (C) Collected corner frequencies (F0.5 = 1/2πτm; mean ± SEM) calculated from τm measurements as in (A), numbers of measurements in each category as in (B). (D) Voltage responses to current steps with hair bundles perfused with 0.02 mM Ca2+ for three gerbil cochlear locations with different CFs. τm obtained from fits (dashed lines) and CF: 0.67 ms (0.35 kHz); 0.23 ms (0.9 kHz); 0.10 ms (2.5 kHz).
Figure 5
Figure 5
Voltage-Dependent K+ Currents in Gerbil OHCs Current records for voltage steps (left), steady-state current-voltage relationships (middle), and conductance-voltage relationships (right) in: P16–P28 animals. CF and recording temperature in (A–D) (left panels) are shown next to traces. Currents were recorded by applying hyperpolarizing and depolarizing voltage steps in 10 mV nominal increments from the holding potential of −84 mV. Holding currents, plotted as zero current, were −148 pA (0.35 kHz), −175 pA (0.9 kHz), −441 pA (2.5 kHz), and −2484 pA (12 kHz).The current-voltage and conductance-voltage relations in (C) and (D) were corrected to 36°C using Q10 of 1.7. Conductance GK determined from GK = I/(V − EK) where EK is the current reversal potential, −75 mV. GK-V relations fitted with single Boltzmann with GK = GK, MAX /(1 + exp (− (V − V0.5)/VS)) where GK, MAX, V0.5, VS are (A) 30 nS, −52 mV, 9.2 mV; (B) 60 nS, −63 mV, 8.4 mV; (C) 107 nS, −67 mV, 11 mV; (D) 280 nS, −56 mV, 18 mV.
Figure 6
Figure 6
Predicted In Vivo OHC Resting Potentials (A) Two main ionic currents in OHCs, IMT flowing through MT channels in the hair bundle that faces endolymph and IK exiting through voltage-dependent K+ channels in the basolateral membrane facing perilymph. There is a +90 mV potential (EP) between endolymph and perilymph. (B) Equivalent electrical circuit for the OHC containing MT conductance, GMT(X), modulated by bundle displacement X and in series with battery EMT, the reversal potential for the MT channels (0 mV); and GK(V) gated by membrane potential V in series with battery EK, the reversal potential for the K+ channels (−75 mV). GOC is a parallel organ of Corti conductance, large compared to OHC membrane conductances. The capacitances of the apical (CA) and basolateral (CB) membranes are also indicated. (C) Predicted resting potential, VR (mean ± SEM), versus CF calculated by inserting into circuit measured values of GMT and GK, corrected to T = 36°C. Dashed line, mean of all values = −40 mV. (D) K+ conductance (GK,r) at OHC resting potential (mean ± SEM) versus CF. Number of measurements indicated beside each point.
Figure 7
Figure 7
Predicted In Vivo Membrane Time Constant and Corner Frequency (A) Linear OHC membrane capacitance, Cm, (mean ± SEM) versus CF for gerbils (filled squares) and rats (filled circles); (B) τm (mean ± SEM) versus CF for gerbils (open squares from Figure 4; filled squares, predicted) and rats (filled circles, predicted); (C) corner frequency, F0.5 (= 1/2πτm) versus CF; continuous line is the fit to the data and the dashed line has slope of 1, where CF equals F0.5.
Figure 8
Figure 8
Membrane Currents, Resting Potentials, and τm in Gerbil IHCs (A and B) Saturating MT currents in apical-coil gerbil IHCs exposed to 1.3 mM Ca2+ (A) and endolymphatic Ca2+ (0.02 mM) (B). Note the larger MT current amplitude and increased POPEN at rest compared to 1.3 mM Ca2+. In 0.02 mM Ca2+ ∼20% of the maximum MT current was activated at rest and this was abolished by 0.2 mM DHS, T = 24°C. (C–E) Voltage-dependent K+ currents in apical gerbil IHCs. Current records for voltage steps in 10 mV nominal increments (C), steady-state current-voltage (D), and conductance-voltage relationships (E) in a P18 IHC, T = 36°C. Conductance GK was determined as described for OHCs (Figure 5) and the conductance-voltage relation was fitted with a single Boltzmann where GK, MAX, V0.5, VS are: 580 nS, −26 mV, 11 mV. (F) Voltage responses to current steps in apical IHCs with hair bundle exposed to 1.3 mM Ca2+, 0.02 mM Ca2+, and 0.2 mM DHS + 0.02 mM Ca2+. τm from fitting voltage onsets (dashed lines): 1.0 ms (1.3 Ca2+), 0.8 ms (0.02 Ca2+), 1.0 ms (0.02 Ca2+ + DHS). (G) IHC resting potential (mean ± SEM; n = 4) for the three conditions in (F). (H) Time constant τm (mean ± SEM) from recordings as in (F).

Comment in

References

    1. Ashmore J. Cochlear outer hair cell motility. Physiol. Rev. 2008;88:173–210. - PubMed
    1. Assad J.A., Hacohen N., Corey D.P. Voltage dependence of adaptation and active bundle movement in bullfrog saccular hair cells. Proc. Natl. Acad. Sci. USA. 1989;86:2918–2922. - PMC - PubMed
    1. Baylor D.A., Lamb T.D., Yau K.W. The membrane current of single rod outer segments. J. Physiol. 1979;288:589–611. - PMC - PubMed
    1. Beurg M., Evans M.G., Hackney C.M., Fettiplace R. A large-conductance calcium-selective mechanotransducer channel in mammalian cochlear hair cells. J. Neurosci. 2006;26:10992–11000. - PMC - PubMed
    1. Beurg M., Nam J.H., Chen Q., Fettiplace R. Calcium balance and mechano-transduction in rat cochlear hair cells. J. Neurophysiol. 2010;104:18–34. - PMC - PubMed

Publication types