

Cervical spine bone mineral density as a function of vertebral level and anatomic location
- PMID: 21689990
- PMCID: PMC3152633
- DOI: 10.1016/j.spinee.2011.05.007
Cervical spine bone mineral density as a function of vertebral level and anatomic location
Abstract
Background context: Bone mineral density (BMD) measurements acquired from quantitative computed tomography scans have been shown to correlate with bone mechanical properties such as strength, stiffness, and yield load. There are currently no reports of BMD as a function of anatomic location within each vertebra.
Purpose: The overall objective of this study was to characterize BMD in the cervical spine as a function of level and anatomic location.
Study design: Cervical spine BMD was evaluated in vivo using a clinically relevant age group.
Patient sample: Twenty-two subjects (13 women and 9 men) were included with an average age of 48 ± 7 years (range, 35-61 years). Ten subjects were recently diagnosed with cervical radiculopathy (age 49 ± 8 years; six women and four men; and two smokers and eight nonsmokers), and 12 subjects were asymptomatic controls (age 46 ± 6 years; seven women and five men; and three smokers, three quit smoking, and six nonsmokers).
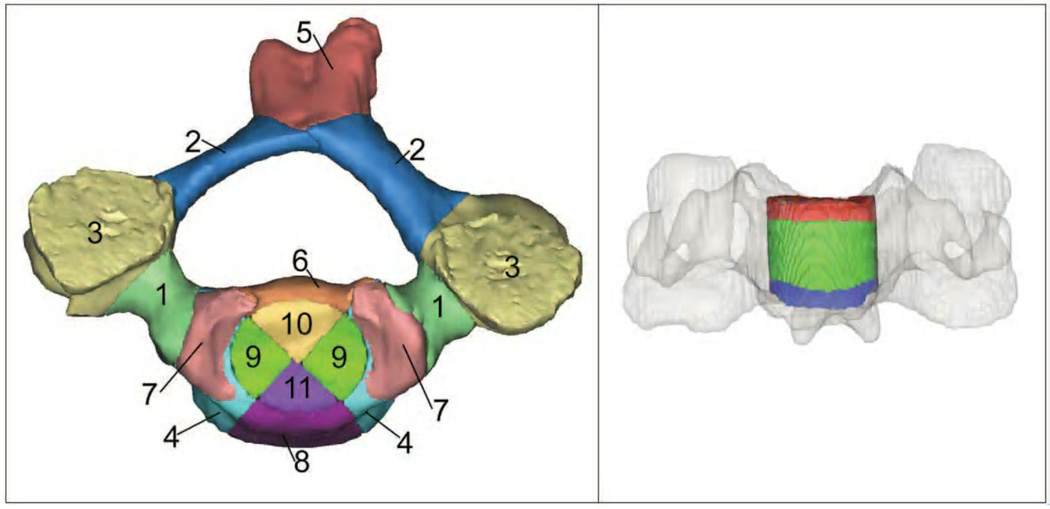
Outcome measures: Physiologic measures included overall BMD for C3-C7, average BMD within 11 anatomically defined regions of interest for each vertebra, and density distribution (by volume) within each anatomic region and vertebral level.
Methods: Subject-specific three-dimensional bone models were created from high-resolution computed tomography scans of the subaxial cervical spine (C3-C7). Custom software calculated the average BMD within 11 anatomically defined regions of interest for each three-dimensional bone model. Bone mineral density values for each voxel of bone tissue were binned into 50 mg/cc ranges to determine the density distribution by volume. Repeated-measures analysis of variance was used to test for differences within subjects by level (C3-C7) and anatomic location. The correlation between BMD in the central vertebral body and the pedicle and lateral mass regions was tested using Pearson correlation.
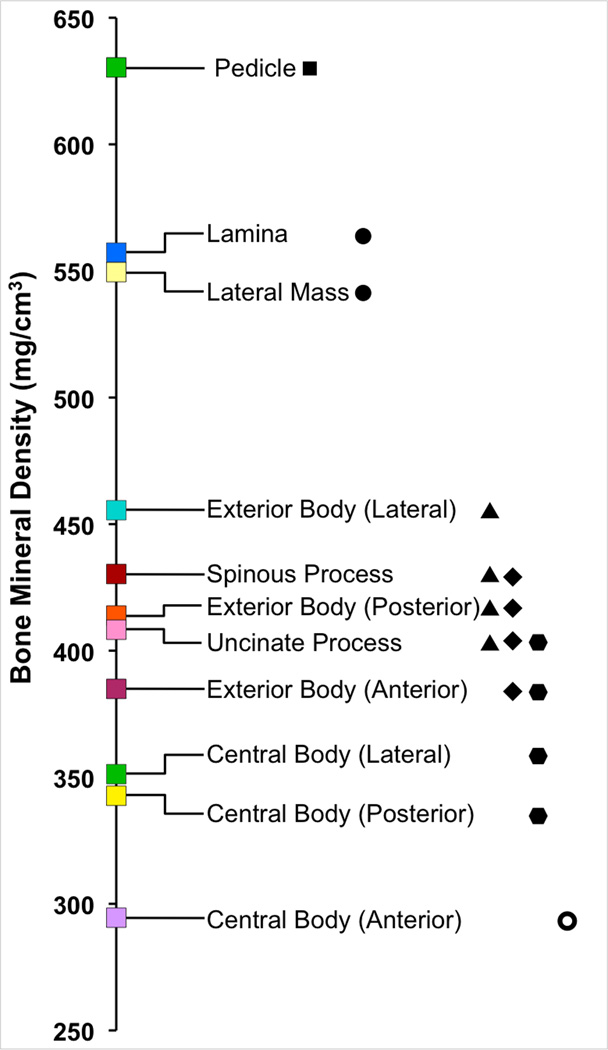
Results: Average BMDs by level were 476, 503, 507, 473, and 414 mg/cm(3) for C3-C7, respectively. C3 and C6 BMDs were significantly less than those of C4 and C5 (p<.007). C7 BMD was significantly less than those of all other levels (all p<.001). Control and female subjects showed a trend toward higher BMD than radiculopathy and male subjects across all levels (p value: .06-.17). Wide variation in BMD was observed over anatomical regions, with the pedicles having significantly higher BMD than all other anatomic locations and the anterior portion of the central vertebral body having significantly lower BMD than all other anatomic locations. There was a significant positive correlation between central vertebral body BMD and lateral mass BMD at each level. Bone mineral density distribution by volume plots revealed women had a higher volume of very high-density bone than men but only in the posterior elements.
Conclusions: This study has characterized BMD in the cervical spine according to vertebral level and anatomic location within each vertebral level using live subjects from a clinically relevant age group. The results indicate significant differences in BMD according to vertebral level and among anatomical regions within each vertebra. The results suggest to the surgeon and device manufacturer that surgical procedures involving instrumentation attached to C7 may require a modification in instrumentation or in surgical technique to attain results equivalent to more superior levels. The results suggest to the basic scientist that computational models may be improved by taking into account the wide variation in BMD over different anatomical regions.
Copyright © 2011 Elsevier Inc. All rights reserved.
Figures


References
-
- Hostin RA, Wu C, Perra JH, et al. A biomechanical evaluation of three revision screw strategies for failed lateral mass fixation. Spine (Phila Pa 1976) 2008;33(22):2415–2421. - PubMed
-
- Hitchon PW, Brenton MD, Coppes JK, et al. Factors affecting the pullout strength of self-drilling and self-tapping anterior cervical screws. Spine (Phila Pa 1976) 2003;28(1):9–13. - PubMed
-
- Zhang X, Ordway NR, Tan R, et al. Correlation of ProDisc-C failure strength with cervical bone mineral content and endplate strength. J Spinal Disord Tech. 2008;21(6):400–405. - PubMed
-
- Jiang Y, Zhao J, Augat P, et al. Trabecular bone mineral and calculated structure of human bone specimens scanned by peripheral quantitative computed tomography: relation to biomechanical properties. J Bone Miner Res. 1998;13(11):1783–1790. - PubMed
Publication types
MeSH terms
Grants and funding
LinkOut - more resources
Full Text Sources
Medical
Miscellaneous
