. 2011 Sep;58(9):2598-606.
doi: 10.1109/TBME.2011.2159790. Epub 2011 Jun 16.

Identification of adequate neurally adjusted ventilatory assist (NAVA) during systematic increases in the NAVA level

Affiliations

Identification of adequate neurally adjusted ventilatory assist (NAVA) during systematic increases in the NAVA level

Dimitrios Ververidis et al. IEEE Trans Biomed Eng. 2011 Sep.

Abstract

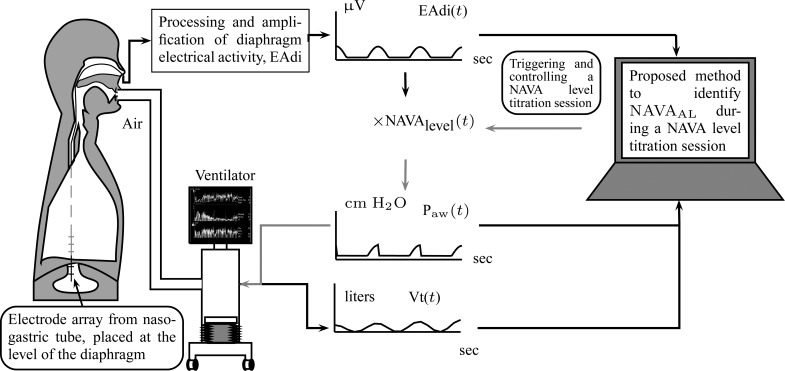
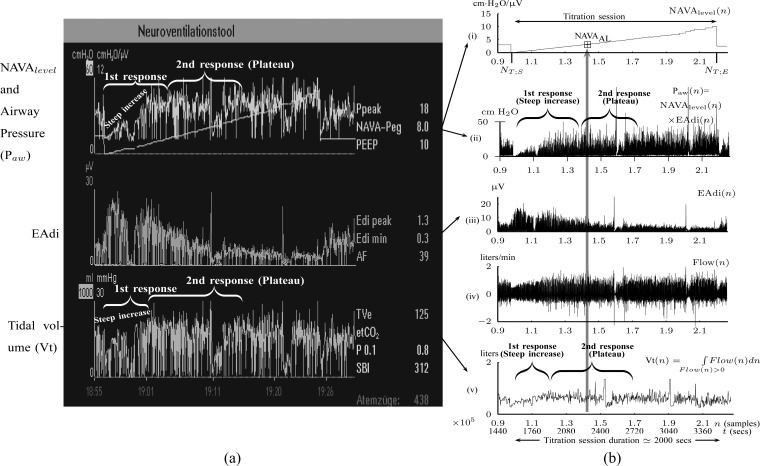
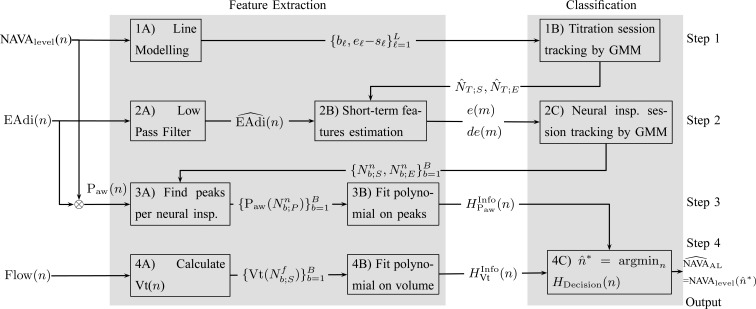
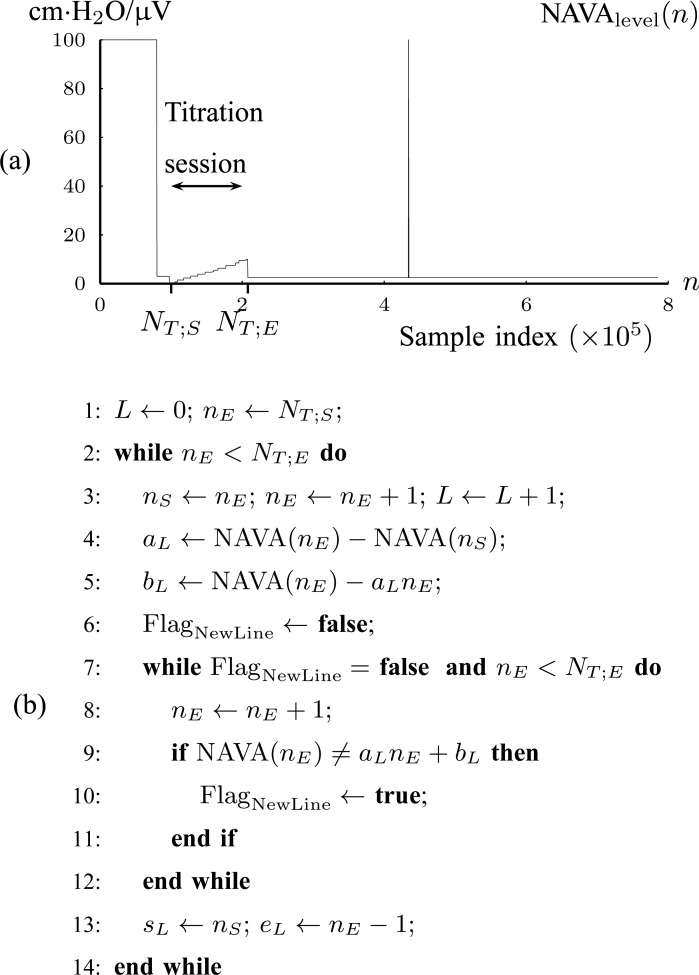
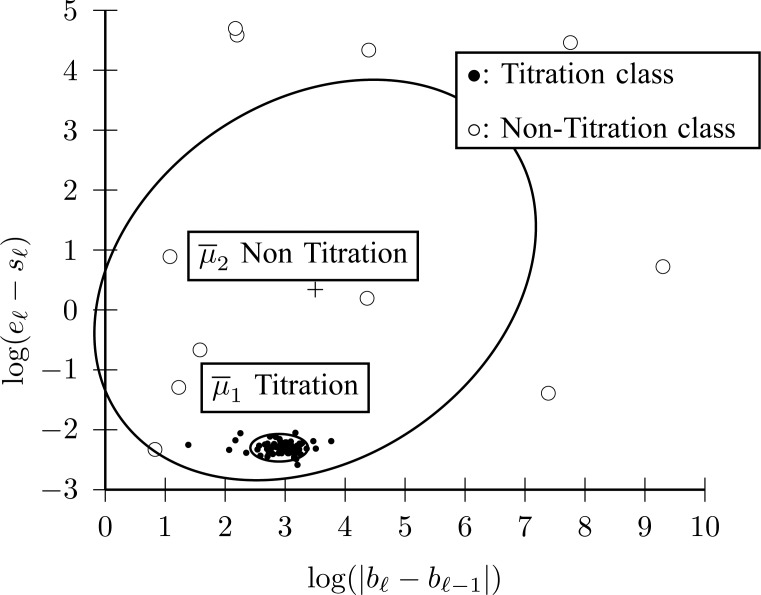
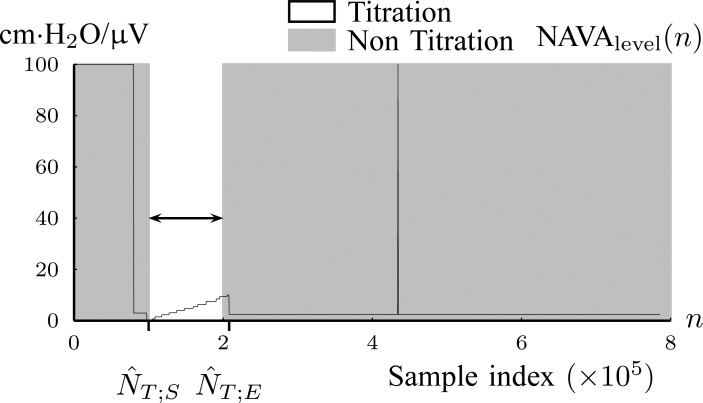
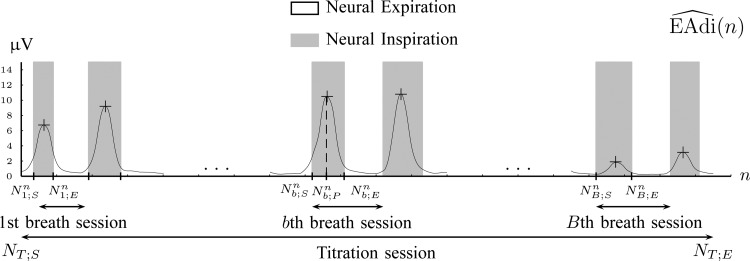
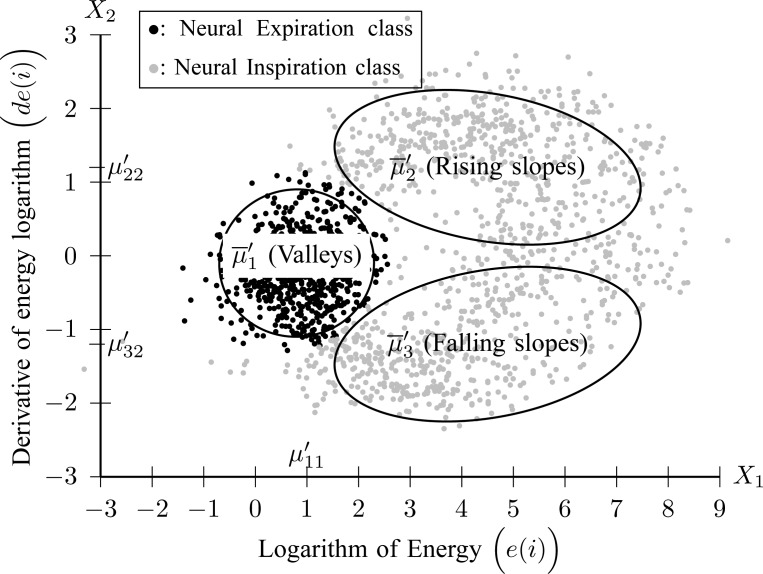
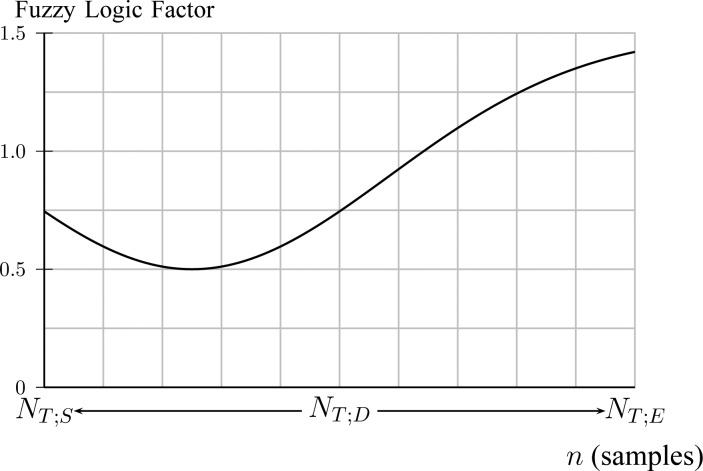
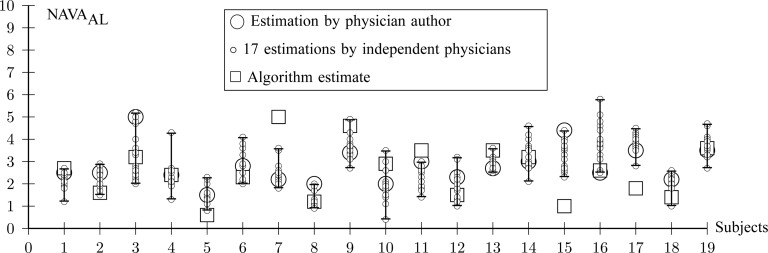
Neurally adjusted ventilatory assist (NAVA) delivers airway pressure (P(aw)) in proportion to the electrical activity of the diaphragm (EAdi) using an adjustable proportionality constant (NAVA level, cm·H(2)O/μV). During systematic increases in the NAVA level, feedback-controlled down-regulation of the EAdi results in a characteristic two-phased response in P(aw) and tidal volume (Vt). The transition from the 1st to the 2nd response phase allows identification of adequate unloading of the respiratory muscles with NAVA (NAVA(AL)). We aimed to develop and validate a mathematical algorithm to identify NAVA(AL). P(aw), Vt, and EAdi were recorded while systematically increasing the NAVA level in 19 adult patients. In a multistep approach, inspiratory P(aw) peaks were first identified by dividing the EAdi into inspiratory portions using Gaussian mixture modeling. Two polynomials were then fitted onto the curves of both P(aw) peaks and Vt. The beginning of the P(aw) and Vt plateaus, and thus NAVA(AL), was identified at the minimum of squared polynomial derivative and polynomial fitting errors. A graphical user interface was developed in the Matlab computing environment. Median NAVA(AL) visually estimated by 18 independent physicians was 2.7 (range 0.4 to 5.8) cm·H(2)O/μV and identified by our model was 2.6 (range 0.6 to 5.0) cm·H(2)O/μV. NAVA(AL) identified by our model was below the range of visually estimated NAVA(AL) in two instances and was above in one instance. We conclude that our model identifies NAVA(AL) in most instances with acceptable accuracy for application in clinical routine and research.


Figures

Fig. 1.
Fig. 1.
Principles of neurally adjusted ventilatory assist (NAVA) . The diaphragm electrical activity (EAdi) derived from electrodes on a naso-gastric feeding tube is first amplified and processed. The EAdi signal is then multiplied by an adjustable gain factor (NAVA level) and used to control the pressure generator of a mechanical ventilator. Thus, NAVA delivers pressure to the airways (formula image) in direct synchrony and linear proportionality to the patient's neural inspiratory drive as reflected by the EAdi (formula image = EAdi(formula image) ⋅ formula image(formula image). Vt = tidal volume. formula image = NAVA level that provides adequate unloading of respiratory muscles.
Fig. 2.
Fig. 2.
Example of a NAVA level titration session as used for estimating formula image(a) visually or (b) with the proposed algorithm. formula image refers to the adequate NAVA level early after the transition from the initial steep increase in formula image and Vt(formula image), referred to as 1st response, to the less steep increase or plateau in formula image and Vt(formula image), referred to as 2nd response –. Flow(formula image) is the air flow. In (a), the Vt(formula image) is estimated on a breath-by-breath basis. If there is false triggering of the ventilator (e.g., based on an EAdi artifact) a minimal Vt (normally a few milliliters) is delivered. Since there is no minimal threshold for Vt, the ventilator displays whatever Vt(formula image) is delivered in the graph. In (b), the Vt(formula image) is calculated as the integral of Flow(formula image) per inspiration as it is described in Section II-B (Step 4A).
Fig. 3.
Fig. 3.
Outline of the algorithm to identify formula image based on the signals formula image(formula image) for the NAVA level, formula image for electrical activity of the diaphragm, and Vtformula image for tidal volume that was derived from the inspiratory flow.
Fig. 4.
Fig. 4.
(a) Tracking of the NAVA level titration session in Patient 1 (Step 1). (b) Algorithm for modeling {formula image(formula image with lines formula image (Step 1A).
Fig. 5.
Fig. 5.
formula image(formula image) titration session tracking by 2 Gaussian components for Fig. 4. The component with small dispersion corresponds to Titration class (Step 1B).
Fig. 6.
Fig. 6.
The result of titration tracking procedure of Fig. 5. The lines that belong to formula image are assigned to the Titration class (Step 1B).
Fig. 7.
Fig. 7.
Tracking of neural inspiration sessions using formula image signal (Step 2C).
Fig. 8.
Fig. 8.
Clustering of formula image frames to Neural Inspiration and Expiration classes (Step 2C).
Fig. 9.
Fig. 9.
The air flow signal, formula image, is divided into inspirations and expirations by zero crossing indices (Step 4A).
Fig. 10.
Fig. 10.
A fuzzy logic factor used for exploiting formula image bias to 0.25 of total duration of titration session (Step 4C).
Fig. 11.
Fig. 11.
Time index of plateau, formula image, is found when formula image is minimized, as described in Steps 3 and 4.
Fig. 12.
Fig. 12.
Comparison between formula image independently estimated by one of the authors (L.B., a physician) and by 17 independent physicians based on visual inspection of the airway pressure (formula image) and tidal volume (Vt) response to systematic increases in the NAVA level (circles) and formula image identified by the algorithm described in this paper (squares).
Fig. 13.
Fig. 13.
The graphic interface provides a synopsis of the signal processing steps described in Figs. 2, 5, 8, and 11, and allows for real time assessment of how the algorithm identifies formula image. Ground truth formula image denotes the visually estimated adequate NAVA level.
Fig. 14.
Fig. 14.
NAVA level titration session in patient 17. In this patient the algorithm identified the transition from a steep increase in peak airway pressure (formula image) to a less steep increase or plateau in formula image (i.e., the adequate NAVA level, formula image) clearly below the range of formula image as visually estimated by the clinicians. The discrepancy is most likely due to a short, transitory interruption of the formula image increase during the initial steep increase, i.e., during the 1st response phase (asterisk). We assume that the physicians outperformed the current version of the algorithm in recognizing pattern irregularities.

References

    1. Sinderby C., Navalesi P., Beck J., Skrobik Y., Friberg N. C. S., and Lindström S. G. L., “Neural control of mechanical ventilation in respiratory failure,” in Nat. Med., vol. 5, no. 12, pp. 1433–1436, 1999. - PubMed
    1. Sinderby C., Beck J., Spahija J., Weinberg J., and Grassino A., “Voluntary activation of the human diaphragm in health and disease,” in J. Appl. Physiol., vol. 85, no. 6, pp. 2146–2158, 1998. - PubMed
    1. Beck J., Sinderby C., Lindström L., and Grassino A., “Effects of lung volume on diaphragm EMG signal strength during voluntary contractions,” in J. Appl. Physiol., vol. 85, no. 3, pp. 1123–1134, 1998. - PubMed
    1. “ATS/ERS Statement on respiratory muscle testing,” in American Thoracic Society/European Respiratory Society. Std., 2002.
    1. Jolley C., Luo Y., Steier J., Reilly C., Seymour J., Lunt A., Ward K., Rafferty G., and Moxham J., “Neural respiratory drive in healthy subjects and in COPD,” in Eur. Respir. J., vol. 33, no. 2, p. 289, 2009. - PubMed

Publication types