

Mapping behavioural evolution onto brain evolution: the strategic roles of conserved organization in individuals and species
- PMID: 21690129
- PMCID: PMC3130365
- DOI: 10.1098/rstb.2010.0344
Mapping behavioural evolution onto brain evolution: the strategic roles of conserved organization in individuals and species
Abstract
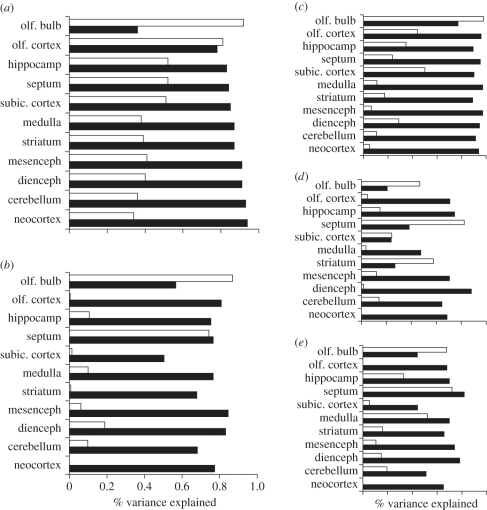
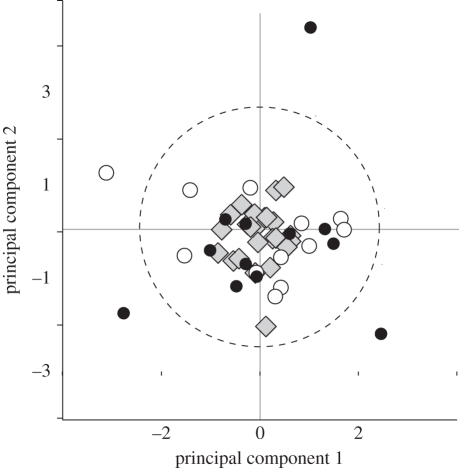
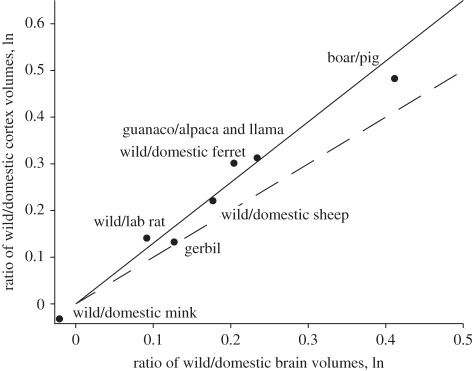
The pattern of individual variation in brain component structure in pigs, minks and laboratory mice is very similar to variation across species in the same components, at a reduced scale. This conserved pattern of allometric scaling resembles robotic architectures designed to be robust to changes in computing power and task demands, and may reflect the mechanism by which both growing and evolving brains defend basic sensory, motor and homeostatic functions at multiple scales. Conserved scaling rules also have implications for species-specific sensory and social communication systems, motor competencies and cognitive abilities. The role of relative changes in neuron number in the central nervous system in producing species-specific behaviour is thus highly constrained, while changes in the sensory and motor periphery, and in motivational and attentional systems increase in probability as the principal loci producing important changes in functional neuroanatomy between species. By their nature, these loci require renewed attention to development and life history in the initial organization and production of species-specific behavioural abilities.
Figures
References
-
- Dukas R. 2004. Evolutionary biology of animal cognition. Annu. Rev. Ecol. Evol. Syst. 35, 347–37410.1146/annurev.ecolsys.35.112202.130152 (doi:10.1146/annurev.ecolsys.35.112202.130152) - DOI - DOI
-
- Jerison H. J. 1973. Evolution of the brain and intelligence. New York, NY: Academic Press
-
- Stephan H., Baron G., Frahm H. D. 1988. Comparative size of brain and brain components. In Comparative primate biology, pp. 1–38 New York, NY: Alan R. Liss
-
- Dunbar R. I. M. 1993. Coevolution of neocortical size, group size and language in humans. Behav. Brain Sci. 16, 681–69410.1017/S0140525X00032325 (doi:10.1017/S0140525X00032325) - DOI - DOI
-
- Barton R. A., Harvey P. H. 2000. Mosaic evolution of brain structure in mammals. Nature 405, 1055–105810.1038/35016580 (doi:10.1038/35016580) - DOI - DOI - PubMed
Publication types
MeSH terms
LinkOut - more resources
Full Text Sources
