. 2011 Sep;79(9):3833-45.
doi: 10.1128/IAI.00040-11. Epub 2011 Jun 20.

Proteomics and pathway analyses of the milk fat globule in sheep naturally infected by Mycoplasma agalactiae provide indications of the in vivo response of the mammary epithelium to bacterial infection

Affiliations

Proteomics and pathway analyses of the milk fat globule in sheep naturally infected by Mycoplasma agalactiae provide indications of the in vivo response of the mammary epithelium to bacterial infection

Maria Filippa Addis et al. Infect Immun. 2011 Sep.

Abstract

Milk fat globules (MFGs) are vesicles released in milk as fat droplets surrounded by the endoplasmic reticulum and apical cell membranes. During formation and apocrine secretion by lactocytes, various amounts of cytoplasmic crescents remain trapped within the released vesicle, making MFGs a natural sampling mechanism of the lactating cell contents. With the aim of investigating the events occurring in the mammary epithelium during bacterial infection, the MFG proteome was characterized by two-dimensional difference gel electrophoresis (2-D DIGE), SDS-PAGE followed by shotgun liquid chromatography-tandem mass spectrometry (GeLC-MS/MS), label-free quantification by the normalized spectral abundance factor (NSAF) approach, Western blotting, and pathway analysis, using sheep naturally infected by Mycoplasma agalactiae. A number of protein classes were found to increase in MFGs upon infection, including proteins involved in inflammation and host defense, cortical cytoskeleton proteins, heat shock proteins, and proteins related to oxidative stress. Conversely, a strikingly lower abundance was observed for proteins devoted to MFG metabolism and secretion. To our knowledge, this is the first report describing proteomic changes occurring in MFGs during sheep infectious mastitis. The results presented here offer new insights into the in vivo response of mammary epithelial cells to bacterial infection and open the way to the discovery of protein biomarkers for monitoring clinical and subclinical mastitis.


Figures

Fig. 1.
Fig. 1.
SDS-PAGE of sheep MFGPs and Western blotting results obtained for the immunodominant M. agalactiae antigen P48. (Left) Total protein profiles of MFGPs extracted from sheep culturally positive for M. agalactiae (lanes 1 and 2), from culturally negative sheep from the same flock (lanes 3 and 4), and from sheep belonging to a CA-negative flock (lanes 5 and 6). Total M. agalactiae proteins were loaded in lane 7 as a control. (Right) Western immunoblotting with antibodies directed against the immunodominant M. agalactiae lipoprotein rP48. M, molecular weight markers.
Fig. 2.
Fig. 2.
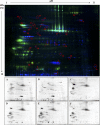
2-D DIGE of MFGPs from M. agalactiae-infected and uninfected sheep. (Top) Overlay image of MFGPs extracted from representative infected (blue) and uninfected (green) milk samples (samples A and D, respectively). Spots indicate proteins with statistically significant differences in amount among all samples examined. Identities of differentially represented proteins are reported in Table 1. (Bottom) Single-channel images of MFGPs extracted from culturally positive sheep milk samples (A and B), from a milk sample with culture negativity and Western immunoblotting positivity for M. agalactiae (C), and from sheep milk samples from a CA-free flock (D to F).
Fig. 3.
Fig. 3.
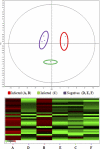
Statistical analysis of 2-D DIGE results. A score plot (upper diagram) and heat map (lower diagram) obtained upon comparison of MFGP samples from M. agalactiae-infected sheep (A, B, and C) with samples from CA-free animals (D, E, and F) are shown. In the heat map, each colored cell represents the protein abundance value for a single sample. Increasingly positive values are indicated by reds of increasing intensity, and increasingly negative values are indicated by greens of increasing intensity. Cells with a value of 0 are colored black.
Fig. 4.
Fig. 4.
Normalized spectral abundance of MFGPs in M. agalactiae-infected (white) and uninfected (black) sheep. Proteins were categorized by DAVID according to cellular localization (A) and function (B). Asterisks indicate statistically significant differences between the two groups according to a two-tailed t test with a 95% confidence level.
Fig. 5.
Fig. 5.
Comparison of RSC values of selected MFGPs. Bars indicate the protein levels in C+/WB+ sheep (black) and C/WB+ sheep (gray) compared to MFGP levels in uninfected sheep.
Fig. 6.
Fig. 6.
Results of Ingenuity pathway analysis. The highest-scoring networks for all differentially represented proteins (A) and for proteins overrepresented (B) and underrepresented (C) in infected sheep are illustrated. (A and B) Results for the highest-scoring network, i.e., cellular movement, hematological system development and function, and immune cell trafficking, are illustrated. (C) Results for the highest-scoring network, i.e., lipid metabolism, molecular transport, and small-molecule biochemistry, are illustrated. Red, overrepresented proteins; green, underrepresented proteins; white, proteins indicated by IPA as significantly associated with the reported network; continuous line, direct relationship; dotted line, indirect relationship. Color intensity represents the extent of differential protein abundance.
Fig. 7.
Fig. 7.
Composite image summarizing results obtained for all milk samples. Results were generated by culture, PCR, and Western immunoblotting for selected cytoskeletal and host defense MFGPs for all samples included in this work. Samples subjected to 2-D DIGE and GeLC-MS/MS are enclosed in the left section of the figure. Sample ID numbers are as indicated in Table 1.

References

    1. Addis M. F., et al. 2009. Generation of high-quality protein extracts from formalin-fixed, paraffin-embedded tissues. Proteomics 9:3815–3823 - PubMed
    1. Addis M. F., Tanca A., Pagnozzi D., Rocca S., Uzzau S. 2009. 2-D PAGE and MS analysis of proteins from formalin-fixed, paraffin-embedded tissues. Proteomics 9:4329–4339 - PubMed
    1. Admyre C., et al. 2007. Exosomes with immune modulatory features are present in human breast milk. J. Immunol. 179:1969–1978 - PubMed
    1. Bergonier D., Berthelot X., Poumarat F. 1997. Contagious agalactia of small ruminants: current knowledge concerning epidemiology, diagnosis and control. Rev. Sci. Tech. 16:848–873 - PubMed
    1. Boehmer J. L., Bannerman D. D., Shefcheck K., Ward J. L. 2008. Proteomic analysis of differentially expressed proteins in bovine milk during experimentally induced Escherichia coli mastitis. J. Dairy Sci. 91:4206–4218 - PubMed

Publication types

MeSH terms