. 2011 Jul 4;208(7):1359-66.
doi: 10.1084/jem.20110283. Epub 2011 Jun 20.

Somatic mutations activating STAT3 in human inflammatory hepatocellular adenomas

Affiliations

Somatic mutations activating STAT3 in human inflammatory hepatocellular adenomas

Camilla Pilati et al. J Exp Med. .

Abstract

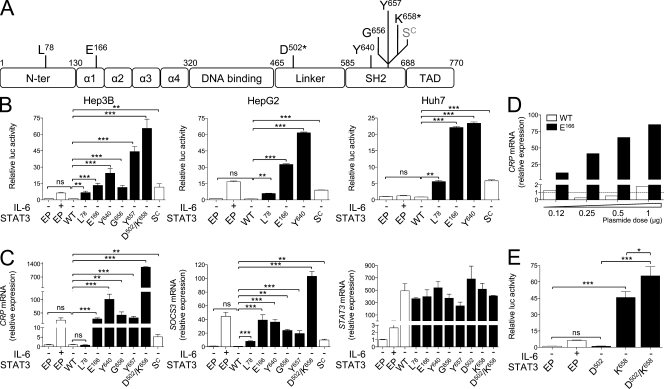
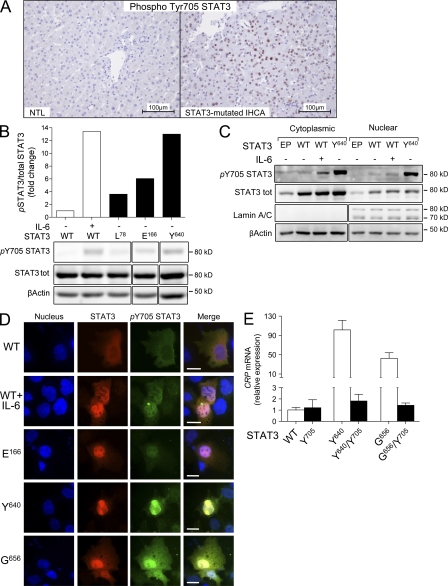
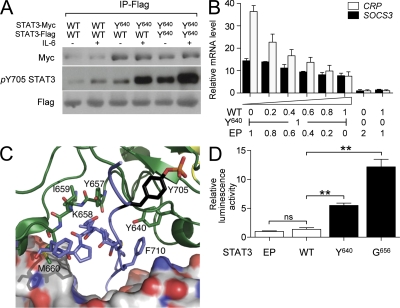
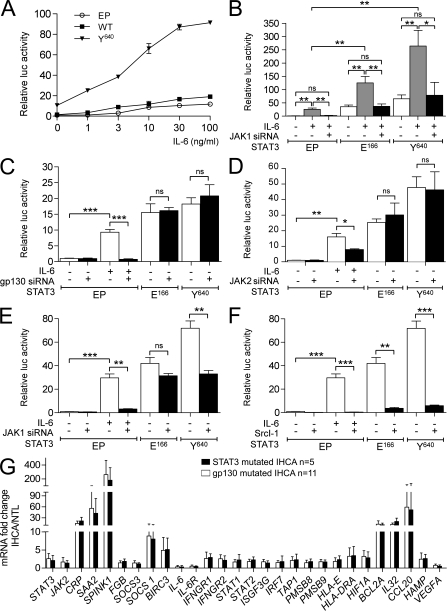
Inflammatory hepatocellular adenomas (IHCAs) are benign liver tumors. 60% of these tumors have IL-6 signal transducer (IL6ST; gp130) mutations that activate interleukin 6 (IL-6) signaling. Here, we report that 12% of IHCA subsets lacking IL6ST mutations harbor somatic signal transducer and activator of transcription 3 (STAT3) mutations (6/49). Most of these mutations are amino acid substitutions in the SH2 domain that directs STAT3 dimerization. In contrast to wild-type STAT3, IHCA STAT3 mutants constitutively activated the IL-6 signaling pathway independent of ligand in hepatocellular cells. Indeed, the IHCA STAT3 Y640 mutant homodimerized independent of IL-6 and was hypersensitive to IL-6 stimulation. This was associated with phosphorylation of tyrosine 705, a residue required for IL-6-induced STAT3 activation. Silencing or inhibiting the tyrosine kinases JAK1 or Src, which phosphorylate STAT3, impaired constitutive activity of IHCA STAT3 mutants in hepatocellular cells. Thus, we identified for the first time somatic STAT3 mutations in human tumors, revealing a new mechanism of recurrent STAT3 activation and underscoring the role of the IL-6-STAT3 pathway in benign hepatocellular tumorigenesis.


Figures

Figure 1.
Figure 1.
Gain-of-function mutations in STAT3 in IHCA. (A) Distribution of STAT3 mutations identified in IHCA is represented according to the different protein domains. Asterisk indicates the two mutations that are found on the same allele in tumor #379. Stat3-C location is indicated in gray. (B) STAT3 mutants L78R (L78), E166Q (E166), Y640F (Y640), D502Y K658Y (D502/K658), G656_Y657insF (G656), Y657_M660dup (Y657), and Stat3-C (SC) or control STAT3 WT (WT) and empty plasmid (EP) were transfected in Hep3B, HepG2, and Huh7 cells expressing a STAT3-driven luciferase (Luc) reporter construct. STAT3 activation was measured after 6 h of serum starvation and, when indicated, was treated for 3 h with 100 ng/ml IL-6. Shown is the Luc activity (mean) determined from triplicate co-transfections (± SD) relative to pSIEM-luc alone (EP) without IL-6. (C) Graphs are qRT–PCR results showing the induction of endogenous CRP, STAT3, and SOCS3 mRNA after overexpression of mutant STAT3 relative to unstimulated EP-transfected Hep3B cells (EP; mean ± SD). (D) Endogenous CRP mRNA expression in Hep3B cells transfected with increasing amounts of expression plasmids encoding WT or E166 STAT3 mutant (dotted line: mock-transfected cells). (E) Activity of the STAT3 mutants, including D502Y (D502), K658Y (K658), and the double mutant D502Y K658Y (D502/K658) were evaluated using STAT3-driven Luc in Hep3B cell line. Data are from triplicate transfections (± SD) relative to pSIEM-luc alone (EP). *, P < 0.05; **, P < 0.01; ***, P < 0.001, two-tailed Student’s t test.
Figure 2.
Figure 2.
Subcellular localization and role of tyrosine 705 phosphorylation in STAT3 IHCA mutants. (A) Immunochemistry of phospho-STAT3-Y705 in STAT3-mutated IHCA and adjacent nontumor liver (NTL). (B–D) Vectors driving the expression of STAT3 mutants, including L78R (L78), E166Q (E166), Y640F (Y640), G656_Y657insF (G656), or WT (WT) STAT3, were transfected into Hep3B cells. (B) Expression of total and phosphorylated (pY705) STAT3 proteins were assessed by Western blot and bands were quantified with ChemiDoc using the Quantity One software; bars show the expression of pY705 STAT3 relative to total STAT3. (C and D) Subcellular localization of total and phosphorylated (pY705) STAT3 proteins were analyzed by Western blot (C) and by immunofluorescence (D). Results are representative of three independent experiments. Bars, 20 µm. (E) CRP mRNA expression after transfection of WT, Y705F (Y705), Y640F (Y640), Y640F/Y705F (Y640/Y705), G656_Y657insF (G656), or G656_Y657insF/Y705F (G656/Y705) STAT3 in unstimulated Hep3B cells. Data are from triplicate transfections (± SD) relative to EP. *, P < 0.05; **, P < 0.01; ***, P < 0.001, two-tailed Student’s t test.
Figure 3.
Figure 3.
Dimerization of STAT3 IHCA mutants. (A) Flag- and Myc-tagged constructs encoding either WT or mutant Y640 STAT3 were co-transfected (1:1) into Hep3B cells treated, or not treated, with 100 ng/mlIL-6. STAT3 dimer formation was detected after immunoprecipitation using the anti-Flag antibody, followed by immunoblot (IB) analysis with Myc, Flag, and pY705-STAT3–specific antibodies. Results are representative of three independent experiments. (B) Effects of increasing WT STAT3 expression (wedge) on the constitutive activity of Y640 mutant STAT3 without IL-6. The graph plots the mean level of expression of SOCS3 and CRP relative to cells transfected with EP (± SD). Units are plasmid micrograms. (C) Several STAT3 IHCA mutations cluster near the TAD of STAT3 (crystal structure; NCBI Protein database accession no. 1BG1; Becker et al., 1998). Residues 640 and 656–660 (shown in green), which are mutated in IHCA tumors, the phosphorylated tyrosine (Tyr-705, black), and TAD residues 711–716 (blue), are shown in stick representation. One polypeptide chain and both TADs are shown as a cartoon. The twofold related molecule, except the TAD, is shown as a surface representation. For residues of the TAD, Tyr-710 of the twofold related molecule is labeled, whereas residues 711–716 are not, for clarity. (D) DNA-binding activity of 10 µg of nuclear extracts of Hep3B cells engineered to express WT, Y640, or G656 STAT3 mutants. Bars indicate the DNA-binding activity to consensus STAT3 oligonucleotides relative to activity measured in cells transfected with EP. *, P < 0.05; **, P < 0.01; ***, P < 0.001, two-tailed Student’s t test. Data are from triplicate transfections (±SD).
Figure 4.
Figure 4.
Role of IL-6–JAK pathway and Src kinases on STAT3 IHCA mutant activation. STAT3 mutants Y640 and E166 were overexpressed in Hep3B cells. Activation of STAT3 is shown by Luc activity (mean) determined from triplicate transfections (± SD) relative to pSIEM-luc alone (EP) with serum starvation. (A) Hep3B cells were exposed to increasing concentrations of IL-6. (B) STAT3 mutants (E166 and Y640) or empty vector (EP) were co-transfected with JAK1 siRNA (+) or control siRNA (−) into Hep3B cells exposed to 100 ng/ml IL-6. (C) STAT3 mutants (E166 and Y640) or empty vector (EP) were co-transfected with gp130 siRNA (+) or control siRNA (−) into Hep3B cells. (D) STAT3 mutants (E166 and Y640) or empty vector (EP) were co-transfected with JAK2 siRNA (+) or control siRNA (−) into Hep3B cells. (E) STAT3 mutants (E166 and Y640) or empty vector (EP) were co-transfected with JAK1 siRNA (+) or control siRNA (v) into Hep3B cells. (F) STAT3 mutants (E166 and Y640) or empty vector (EP) were transfected into Hep3B cells exposed to Src inhibitor 1 (SrcI-1; 10 µM; 9 h). *, P < 0.05; **, P < 0.01; ***, P < 0.001, two-tailed Student’s t test. Data are from triplicate transfections (± SD). (G) Expression profiles of STAT3-mutated IHCA and gp130-mutated IHCA. Comparison was performed for the 28 genes validated by qRT-PCR that were significantly differentially expressed between IHCA and nontumorous livers. 5 STAT3-mutated IHCAs (black) were compared with 11 gp130-mutated IHCAs (in white). Results are expressed as mean ± SD; differences between groups are not significant (two-tailed Mann-Whitney test).

References

    1. Becker S., Groner B., Müller C.W. 1998. Three-dimensional structure of the Stat3beta homodimer bound to DNA. Nature. 394:145–151 10.1038/28101 - DOI - PubMed
    1. Bioulac-Sage P., Rebouissou S., Thomas C., Blanc J.F., Saric J., Sa Cunha A., Rullier A., Cubel G., Couchy G., Imbeaud S., et al. 2007. Hepatocellular adenoma subtype classification using molecular markers and immunohistochemistry. Hepatology. 46:740–748 10.1002/hep.21743 - DOI - PubMed
    1. Bluteau O., Jeannot E., Bioulac-Sage P., Marqués J.M., Blanc J.F., Bui H., Beaudoin J.C., Franco D., Balabaud C., Laurent-Puig P., Zucman-Rossi J. 2002. Bi-allelic inactivation of TCF1 in hepatic adenomas. Nat. Genet. 32:312–315 10.1038/ng1001 - DOI - PubMed
    1. Bromberg J.F., Wrzeszczynska M.H., Devgan G., Zhao Y., Pestell R.G., Albanese C., Darnell J.E., Jr 1999. Stat3 as an oncogene. Cell. 98:295–303 10.1016/S0092-8674(00)81959-5 - DOI - PubMed
    1. Chen X., Bhandari R., Vinkemeier U., Van Den Akker F., Darnell J.E., Jr, Kuriyan J. 2003. A reinterpretation of the dimerization interface of the N-terminal domains of STATs. Protein Sci. 12:361–365 10.1110/ps.0218903 - DOI - PMC - PubMed

Publication types

MeSH terms