

Population pharmacokinetics of ethambutol in South African tuberculosis patients
- PMID: 21690284
- PMCID: PMC3165318
- DOI: 10.1128/AAC.00274-11
Population pharmacokinetics of ethambutol in South African tuberculosis patients
Abstract
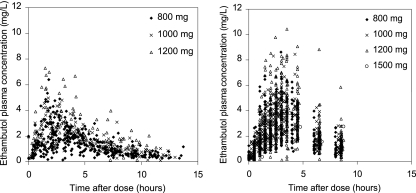
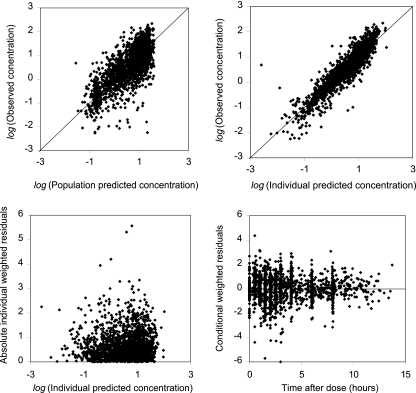
Ethambutol, one of four drugs in the first-line antitubercular regimen, is used to protect against rifampin resistance in the event of preexisting resistance to isoniazid. The population pharmacokinetics of ethambutol in South African patients with pulmonary tuberculosis were characterized using nonlinear mixed-effects modeling. Patients from 2 centers were treated with ethambutol (800 to 1,500 mg daily) combined with standard antitubercular medication. Plasma concentrations of ethambutol were measured following multiple doses at steady state and were determined using a validated high-pressure liquid chromatography-tandem mass spectrometric method. The data comprised 189 patients (54% male, 12% HIV positive) weighing 47 kg, on average (range, 29 to 86 kg), and having a mean age of 36 years (range, 16 to 72 years). The estimated creatinine clearance was 79 ml/min (range, 23 to 150 ml/min). A two-compartment model with one transit compartment prior to first-order absorption and allometric scaling by body weight on clearance and volume terms was selected. HIV infection was associated with a 15% reduction in bioavailability. Renal function was not related to ethambutol clearance in this cohort. Interoccasion variability exceeded interindividual variability for oral clearance (coefficient of variation, 36 versus 20%). Typical oral clearance in this analysis (39.9 liters/h for a 50-kg individual) was lower than that previously reported, a finding partly explained by the differences in body weight between the studied populations. In summary, a population model describing the pharmacokinetics of ethambutol in South African tuberculosis patients was developed, but additional studies are needed to characterize the effects of renal function.
Figures


References
-
- Ameer B., Polk R. E., Kline B. J., Grisafe J. P. 1982. Effect of food on ethambutol absorption. Clin. Pharm. 1:156–158 - PubMed
-
- American Thoracic Society/Centers for Disease Control and Prevention/Infectious Diseases Society of America 2003. Treatment of tuberculosis. Am. J. Respir. Crit. Care Med. 167:603–662 - PubMed
-
- Anderson B. J., Holford N. H. G. 2009. Mechanistic basis of using body size and maturation to predict clearance in humans. Drug Metab. Pharmacokinet. 24:25–36 - PubMed
-
- Beal S. L., Sheiner L. B., Boeckmann A. J. 1989-2006. NONMEM user's guides. Icon Development Solutions, Ellicott City, MD
Publication types
MeSH terms
Substances
Grants and funding
LinkOut - more resources
Full Text Sources
Medical
