. 2011 Jul 5;108(27):11285-90.
doi: 10.1073/pnas.1100483108. Epub 2011 Jun 20.

Diffusion model for one-choice reaction-time tasks and the cognitive effects of sleep deprivation

Affiliations

Diffusion model for one-choice reaction-time tasks and the cognitive effects of sleep deprivation

Roger Ratcliff et al. Proc Natl Acad Sci U S A. .

Abstract

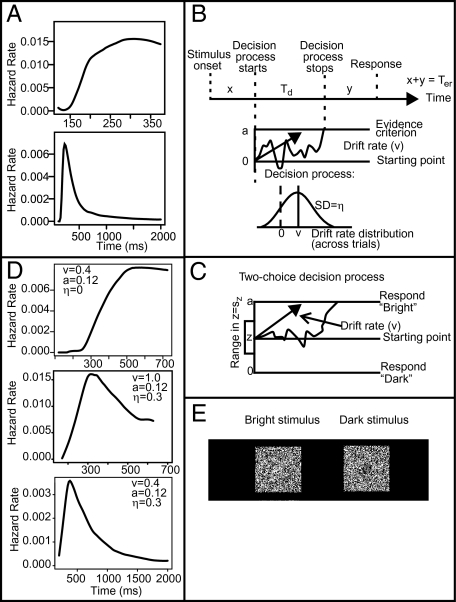
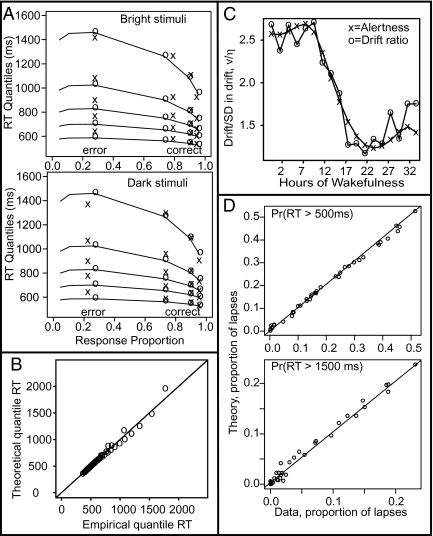
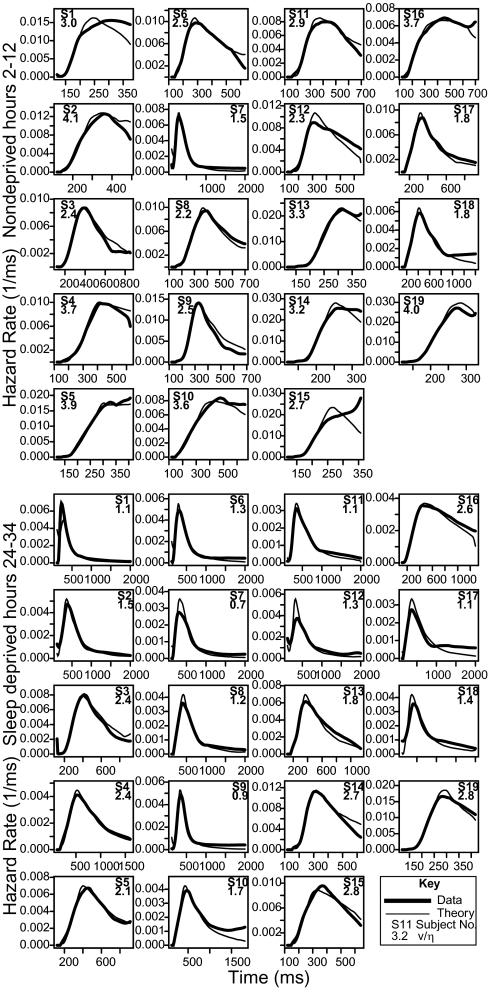
One-choice reaction-time (RT) tasks are used in many domains, including assessments of motor vehicle driving and assessments of the cognitive/behavioral consequences of sleep deprivation. In such tasks, subjects are asked to respond when they detect the onset of a stimulus; the dependent variable is RT. We present a cognitive model for one-choice RT tasks that uses a one-boundary diffusion process to represent the accumulation of stimulus information. When the accumulated evidence reaches a decision criterion, a response is initiated. This model is distinct in accounting for the RT distributions observed for one-choice RT tasks, which can have long tails that have not been accurately captured by earlier cognitive modeling approaches. We show that the model explains performance on a brightness-detection task (a "simple RT task") and on a psychomotor vigilance test. The latter is used extensively to examine the clinical and behavioral effects of sleep deprivation. For the brightness-detection task, the model explains the behavior of RT distributions as a function of brightness. For the psychomotor vigilance test, it accounts for lapses in performance under conditions of sleep deprivation and for changes in the shapes of RT distributions over the course of sleep deprivation. The model also successfully maps the rate of accumulation of stimulus information onto independently derived predictions of alertness. The model is a unified, mechanistic account of one-choice RT under conditions of sleep deprivation.


Conflict of interest statement

The authors declare no conflict of interest.

Figures

Fig. 1.
Fig. 1.
(A) Two hazard functions taken from one subject in a sleep deprivation experiment. (Upper) A nondeprived condition; (Lower) a sleep-deprived condition. (B) Illustration of the one-choice diffusion model. Evidence is accumulated at a drift rate v with SD across trials η, until a decision criterion at a is reached after time Td. Additional processing times include stimulus encoding time x and response output time y; these sum to nondecision time Ter, which has uniform variability across trials with range st. (C) Illustration of the well-established two-choice diffusion model (4, 5, 18). Boundary separation is a, starting point is z, and range of variability in the starting point is sz. The other components of the model are the same as the one-choice model. (D) Sample hazard functions from the model, with parameters varied as shown. Compare with A. (E) Sample single frames of the stimuli for experiment 1.
Fig. 2.
Fig. 2.
(A) Quantile probability plots for the two-choice data from experiment 1. The “x” symbols denote the data and the “o” symbols and lines represent the model predictions (see ref. for further explanation). The plots show the 0.1, 0.3, 0.5, 0.7, and 0.9 quantile RTs (stacked curves) plotted against response proportion. Error data are shown for only one of the three levels of difficulty, because several subjects had zero errors in the other conditions (so quantiles cannot be computed). (B) Experimental and theoretical RT quantiles averaged over subjects for the one-choice data from experiment 1. The diagonal line has slope 1 and intercept 0. (C) Ratio of drift rate to SD in drift rate (v/η) plotted against independently derived alertness predictions for the data from experiment 2. (D) Proportion of performance lapses with RTs > 500 ms (Upper) and RTs > 1,500 ms (Lower) for the data from experiment 2, and corresponding model predictions. Each point represents data from a single subject for either the sleep-deprived or nondeprived conditions. The diagonal lines have slope 1 and intercept 0.
Fig. 3.
Fig. 3.
Hazard functions for individual subjects’ data from experiment 2 (narrow lines) and predicted hazard functions from fits of the one-choice diffusion model (thick lines) for sleep-deprived and nondeprived conditions. The legend in each figure shows the subject number, as well as the model-derived ratio of mean drift rate to SD in drift rate (v/η). The latter provides an index of the length of the right tail of the RT distribution.

References

    1. Cooper JM, Strayer DL. Effects of simulator practice and real-world experience on cell-phone–related driver distraction. Hum Factors. 2008;50:893–902. - PubMed
    1. Narayanan NS, Laubach M. Top-down control of motor cortex ensembles by dorsomedial prefrontal cortex. Neuron. 2006;52:921–931. - PMC - PubMed
    1. Gunzelmann G, Byrne MD, Gluck KA, Moore LR., Jr Using computational cognitive modeling to predict dual-task performance with sleep deprivation. Hum Factors. 2009;51:251–260. - PubMed
    1. Ratcliff R, McKoon G. The diffusion decision model: Theory and data for two-choice decision tasks. Neural Comput. 2008;20:873–922. - PMC - PubMed
    1. Wagenmakers EJ. Methodological and empirical developments for the Ratcliff diffusion model of response times and accuracy. Eur J Cogn Psychol. 2009;21:641–671.

Publication types

LinkOut - more resources