

Multiscale approach to link red blood cell dynamics, shear viscosity, and ATP release
- PMID: 21690355
- PMCID: PMC3131338
- DOI: 10.1073/pnas.1101315108
Multiscale approach to link red blood cell dynamics, shear viscosity, and ATP release
Abstract
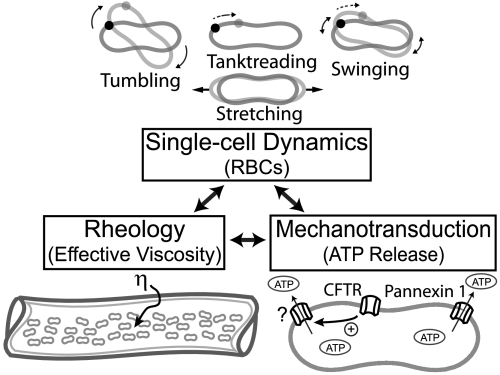
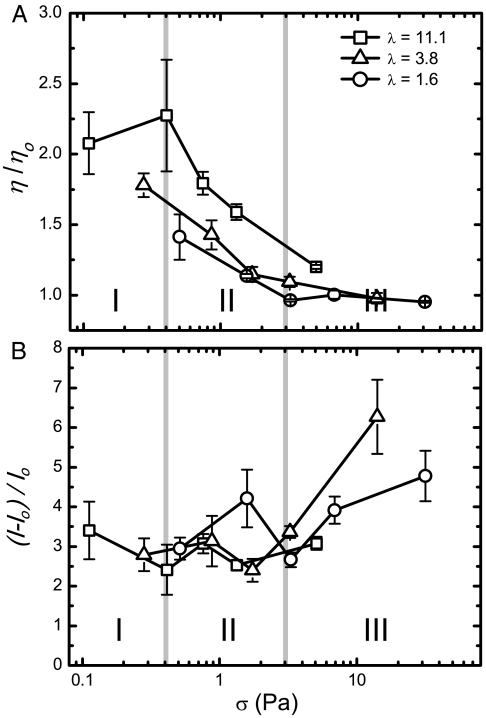
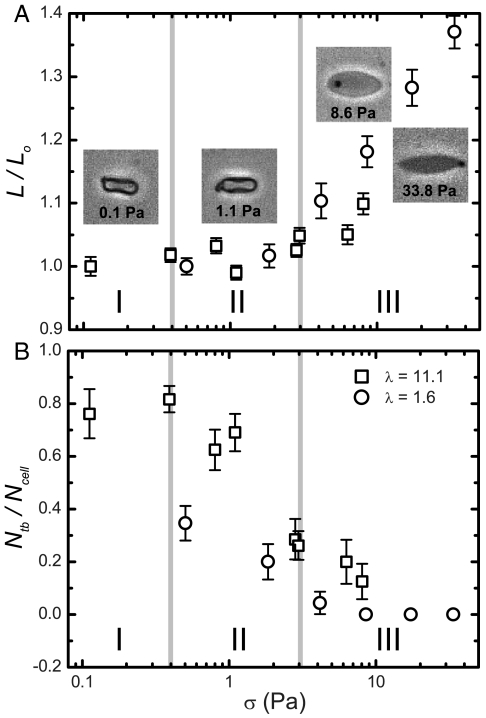
RBCs are known to release ATP, which acts as a signaling molecule to cause dilation of blood vessels. A reduction in the release of ATP from RBCs has been linked to diseases such as type II diabetes and cystic fibrosis. Furthermore, reduced deformation of RBCs has been correlated with myocardial infarction and coronary heart disease. Because ATP release has been linked to cell deformation, we undertook a multiscale approach to understand the links between single RBC dynamics, ATP release, and macroscopic viscosity all at physiological shear rates. Our experimental approach included microfluidics, ATP measurements using a bioluminescent reaction, and rheology. Using microfluidics technology with high-speed imaging, we visualize the deformation and dynamics of single cells, which are known to undergo motions such as tumbling, swinging, tanktreading, and deformation. We report that shear thinning is not due to cellular deformation as previously believed, but rather it is due to the tumbling-to-tanktreading transition. In addition, our results indicate that ATP release is constant at shear stresses below a threshold (3 Pa), whereas above the threshold ATP release is increased and accompanied by large cellular deformations. Finally, performing experiments with well-known inhibitors, we show that the Pannexin 1 hemichannel is the main avenue for ATP release both above and below the threshold, whereas, the cystic fibrosis transmembrane conductance regulator only contributes to deformation-dependent ATP release above the stress threshold.
Conflict of interest statement
The authors declare no conflict of interest.
Figures
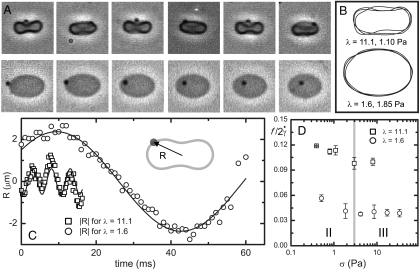
 , where f = ω/2π, versus shear stress. Error bars = ± 1 SEM; N = 3–8.
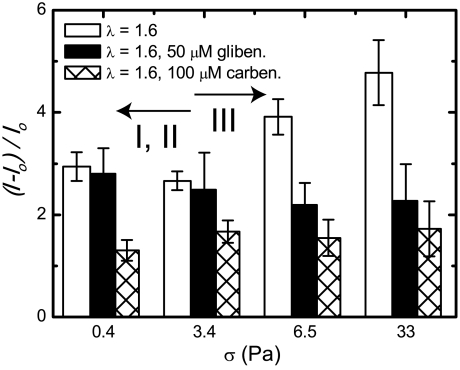
References
-
- Dietrich HH, Ellsworth ML, Sprague RS, Dacey RG., Jr Red blood cell regulation of microvascular tone through adenosine triphosphate. Am J Physiol Heart Circ Physiol. 2000;278:H1294–1298. - PubMed
-
- Sprague RS, Ellsworth ML, Stephenson AH, Lonigro AJ. ATP: the red blood cell link to NO and local control of the pulmonary circulation. Am J Physiol. 1996;271:H2717–2722. - PubMed
-
- Sprague RS, et al. Effect of L-NAME on pressure-flow relationships in isolated rabbit lungs: Role of red blood cells. Am J Physiol. 1995;269:H1941–1948. - PubMed
-
- Chien S. Red cell deformability and its relevance to blood flow. Annu Rev Physiol. 1987;49:177–192. - PubMed
MeSH terms
Substances
LinkOut - more resources
Full Text Sources
