. 2011 Jul 5;108(27):10992-6.
doi: 10.1073/pnas.1104651108. Epub 2011 Jun 20.

Measuring single-cell density

Affiliations

Measuring single-cell density

William H Grover et al. Proc Natl Acad Sci U S A. .

Abstract

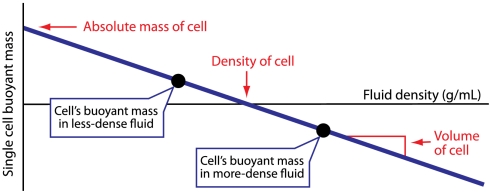
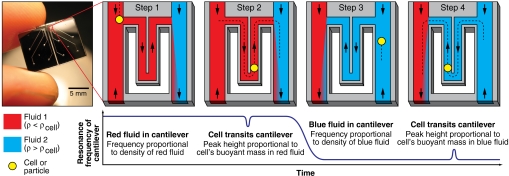
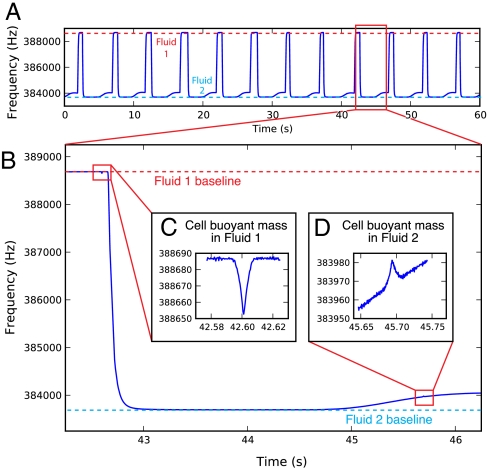
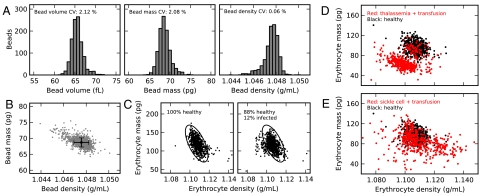
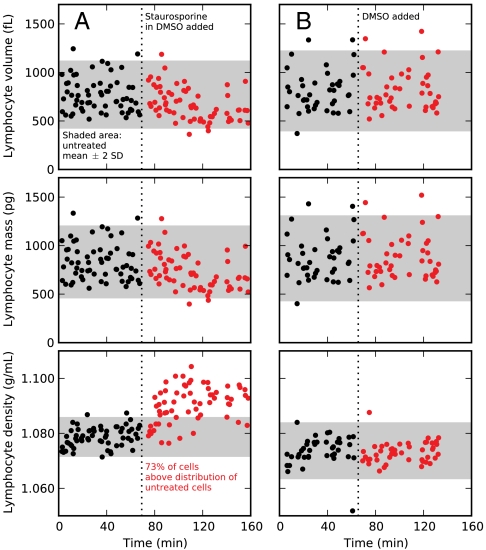
We have used a microfluidic mass sensor to measure the density of single living cells. By weighing each cell in two fluids of different densities, our technique measures the single-cell mass, volume, and density of approximately 500 cells per hour with a density precision of 0.001 g mL(-1). We observe that the intrinsic cell-to-cell variation in density is nearly 100-fold smaller than the mass or volume variation. As a result, we can measure changes in cell density indicative of cellular processes that would be otherwise undetectable by mass or volume measurements. Here, we demonstrate this with four examples: identifying Plasmodium falciparum malaria-infected erythrocytes in a culture, distinguishing transfused blood cells from a patient's own blood, identifying irreversibly sickled cells in a sickle cell patient, and identifying leukemia cells in the early stages of responding to a drug treatment. These demonstrations suggest that the ability to measure single-cell density will provide valuable insights into cell state for a wide range of biological processes.


Conflict of interest statement

Conflict of interest statement: S.R.M. is a cofounder of Affinity Biosensors and declares competing financial interests.

Figures

Fig. 1.
Fig. 1.
Applying Archimedes’ method to measure single-cell mass, volume, and density. By weighing a cell in two fluids of different density and plotting the linear relationship between buoyant mass and fluid density, the absolute mass, volume, and density of the cell can be determined from the y intercept, slope, and x intercept, respectively.
Fig. 2.
Fig. 2.
Using the SMR (Left) to measure the buoyant mass of a cell in two fluids of different densities. Measurement starts with the cantilever filled with any buffer or media less dense than the cell (red, step 1). The density of the red fluid is determined from the baseline resonance frequency of the cantilever. When a cell passes through the cantilever (step 2), the buoyant mass of the cell in the red fluid is calculated from the height of the peak in the resonance frequency. The direction of fluid flow is then reversed, and the resonance frequency of the cantilever drops as the cantilever fills with a fluid more dense than the cell (blue, step 3). The buoyant mass of the cell in the blue fluid is measured as the cell transits the cantilever a second time (step 4). From these four measurements of fluid density and cell buoyant mass, the absolute mass, volume, and density of the cell are calculated.
Fig. 3.
Fig. 3.
(A) One minute of the raw resonance frequency of the SMR for 12 cell density measurements. On this scale, only the fluctuations caused by the switching between two different buffer densities are visible. (B) Close-up of the measurement of a single healthy human erythrocyte, showing (C) an approximately 30-Hz downward peak in the SMR resonance frequency as the cell surrounded by Fluid 1 is measured, then a large (approximately 5,000-Hz) decrease as more-dense Fluid 2 passes through the cantilever, and finally (D) an approximately 10-Hz upward peak as the cell surrounded by Fluid 2 is measured. A small amount of Fluid 1 enters the Fluid 2 stream during the first pass of the cell through the cantilever (C); some of this dilute mixture accompanies the cell during its second pass through the cantilever and causes a gradually increasing baseline around the second peak (D).
Fig. 4.
Fig. 4.
(A) Bead mass, volume, and density distributions for a population of 5.0-μm-diameter polystyrene beads (n = 1,069), and (B) a scatter plot of bead mass vs. density. Error bars are ± one standard deviation of the mean. (C) Erythrocyte mass vs. density for 690 cells from a healthy erythrocyte culture (Left) and an equal number of cells from a culture containing approximately 12% P. falciparum-infected erythrocytes (Right). The small fraction of less-dense infected cells lies to the left of the healthy cells (circled); these infected cells are indistinguishable by mass but clearly distinguished by density. In this and subsequent plots, the markers are roughly equal in size to the error bars in (B). (D) Single erythrocyte mass vs. density for an individual with suspected thalassemia trait who also received a transfusion of normal (nonthalassemic) blood 4 d prior to collection (red; n = 502 cells) compared to a random nonthalassemic, nontransfused individual (black; n = 502 cells). The patient’s own erythrocytes (red) are offset from a normal patient’s erythrocytes (black), except for a small number of normal erythrocytes the thalassemic patient received during the transfusion (red points clustered on black points). (E) Erythrocytes from an individual with sickle-cell anemia who also received a blood transfusion 35 d before collection (red; n = 502 cells) compared to the same nontransfused individual as in D (black; n = 502 cells). The widening of the distribution of erythrocyte densities in sickle cell anemia is consistent with other studies (6), with the more-dense cells likely representing irreversibly sickled cells (15).
Fig. 5.
Fig. 5.
Time-course data of single-cell masses, volumes, and densities of L1210 mouse lymphocytic leukemia cells before (black) and after (red) the addition of either STS (A; n = 123 cells) or an equal volume of DMSO (B; n = 86 mock-treated cells). Shaded areas represent the mass, volume, and density distributions of the untreated cells (mean ± two standard deviations). We observed 73% of treated cells have a density greater than the untreated cells, but < 5% of treated cells have a significantly altered mass or volume. Density uniquely identifies the drug-treated cells with a certainty that is impossible by mass or volume measurements.

References

    1. Wolff DA, Pertoft H. Separation of HeLa cells by colloidal silica density gradient centrifugation. I. Separation and partial synchrony of mitotic cells. J Cell Biol. 1972;55:579–585. - PMC - PubMed
    1. Martin SJ, Bradley JG, Cotter TG. HL-60 cells induced to differentiate towards neutrophils subsequently die via apoptosis. Clin Exp Immunol. 1990;79:448–453. - PMC - PubMed
    1. Wyllie AH, Morris RG. Hormone-induced cell death. Purification and properties of thymocytes undergoing apoptosis after glucocorticoid treatment. Am J Pathol. 1982;109:78–87. - PMC - PubMed
    1. Maric D, Maric I, Barker JL. Buoyant density gradient fractionation and flow cytometric analysis of embryonic rat cortical neurons and progenitor cells. Methods. 1998;16:247–259. - PubMed
    1. Mrema JE, Campbell GH, Miranda R, Jaramillo AL, Rieckmann KH. Concentration and separation of erythrocytes infected with Plasmodium falciparum by gradient centrifugation. Bull World Health Organ. 1979;57:133–138. - PMC - PubMed

Publication types