. 2011 Jul 1;117(13):2926-38.
doi: 10.1002/cncr.25868. Epub 2011 Jan 10.

Glucose, not glutamine, is the dominant energy source required for proliferation and survival of head and neck squamous carcinoma cells

Affiliations

Glucose, not glutamine, is the dominant energy source required for proliferation and survival of head and neck squamous carcinoma cells

Vlad C Sandulache et al. Cancer. .

Abstract

Background: Tumor metabolism is an essential contributor to disease progression and response to treatment. An understanding of the metabolic phenotype of head and neck squamous cell carcinoma (HNSCC) will allow the development of appropriate antimetabolic strategies for this tumor type.

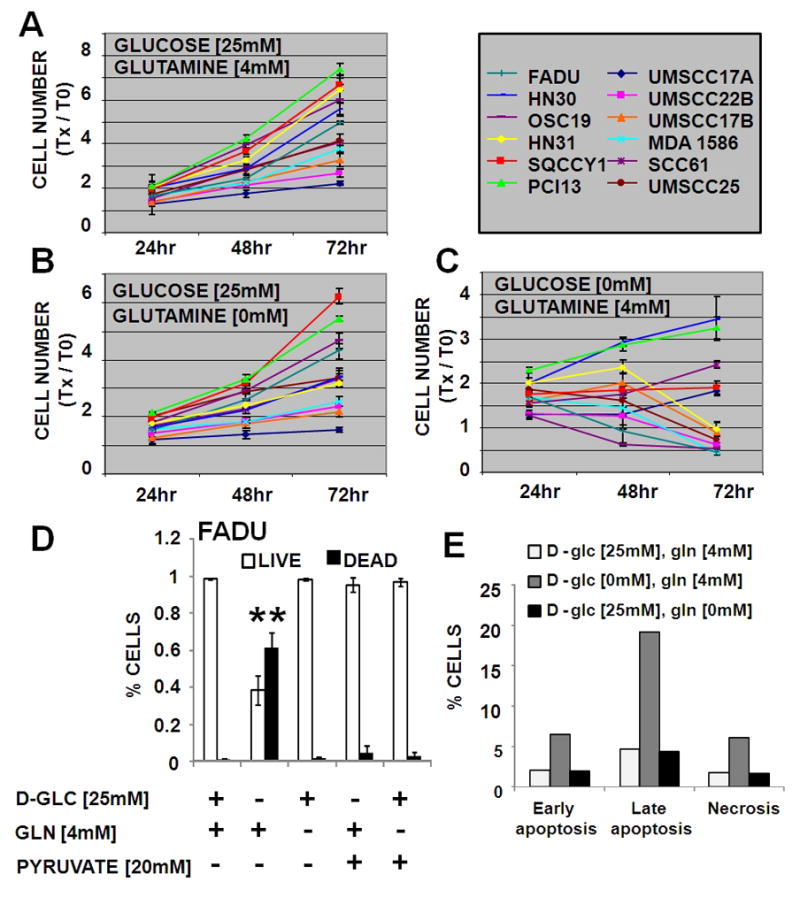
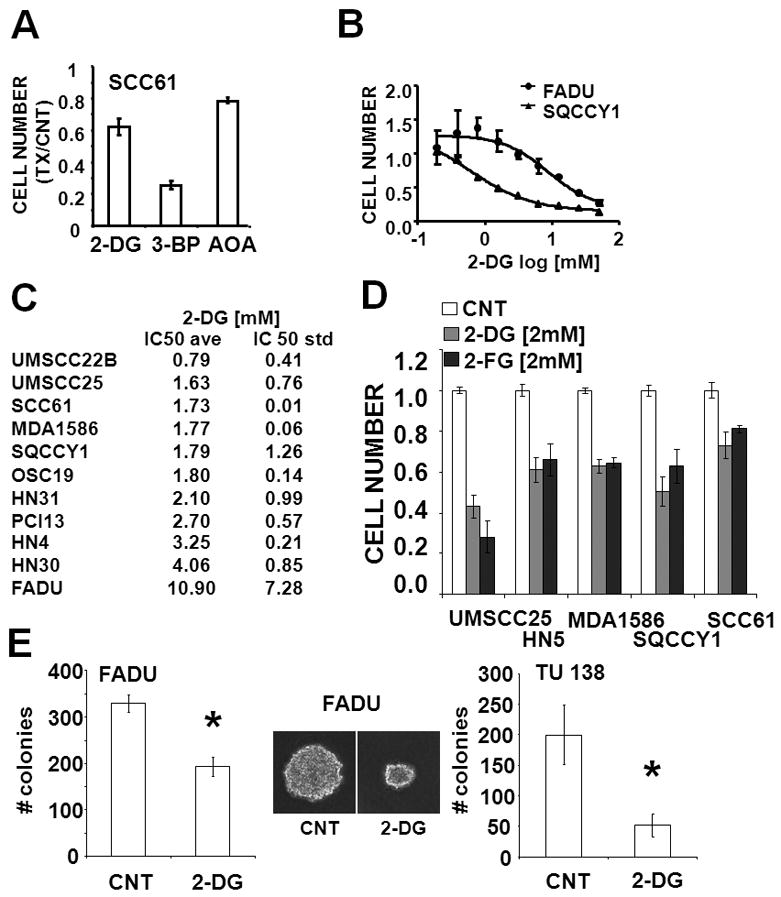
Methods: A panel of 15 HNSCC cell lines was assayed for glucose and glutamine dependence and sensitivity to metabolic inhibitors. In addition, broad-spectrum metabolomic analysis using mass spectrometry/liquid chromatography was combined with individual measurements of reducing potential, adenosine triphosphate, and lactate production to characterize cellular metabolic phenotypes.

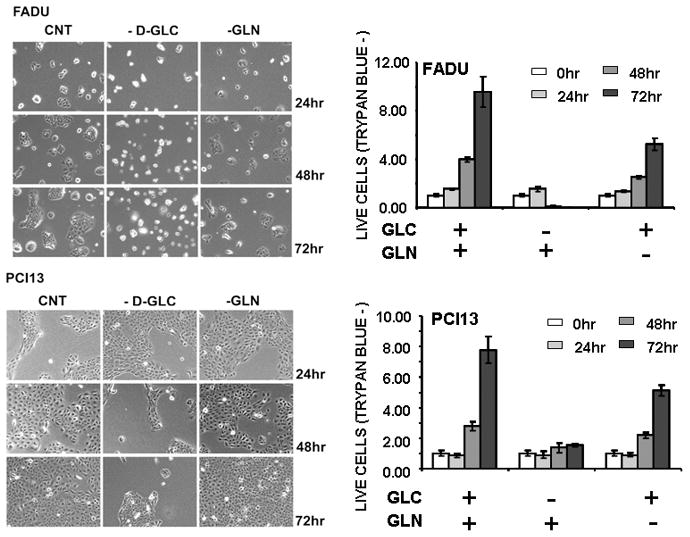
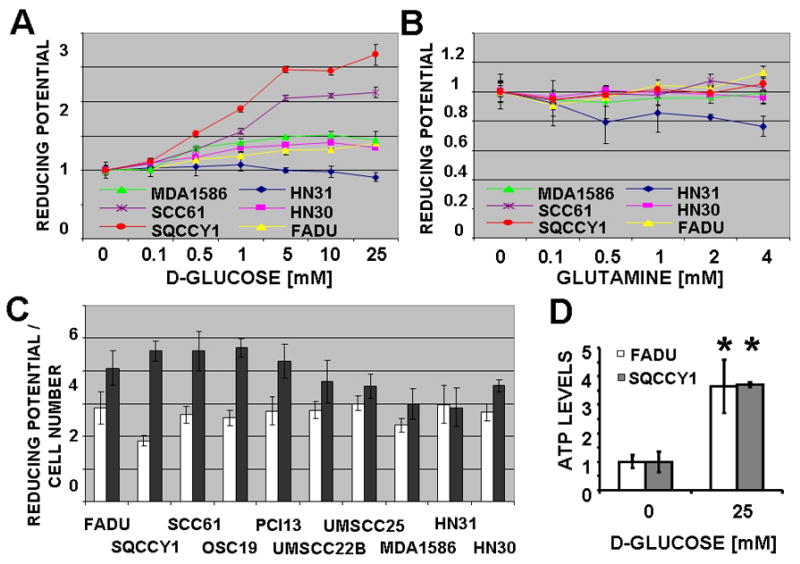
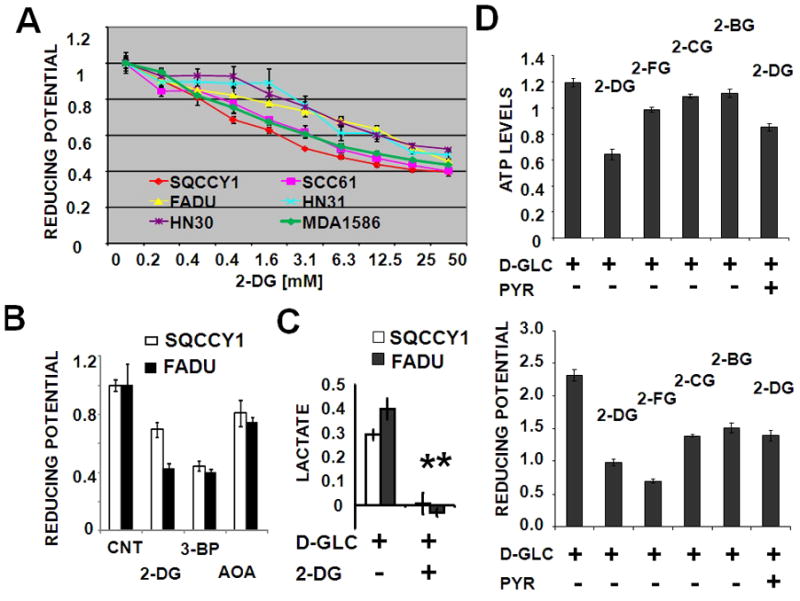
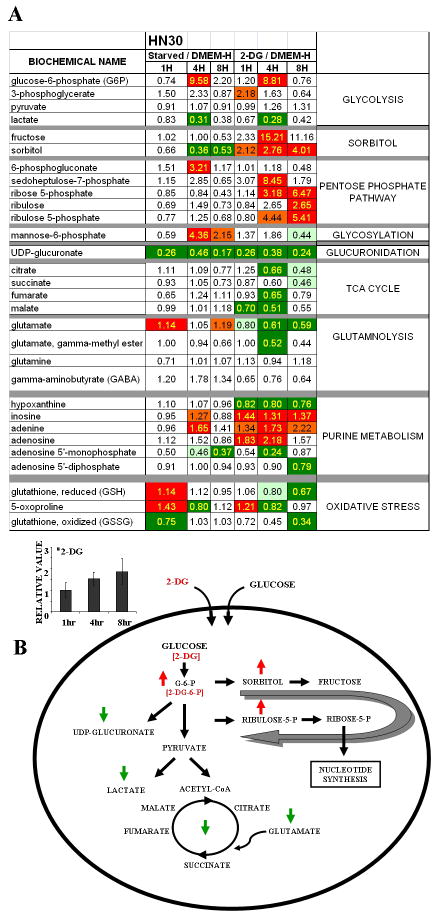
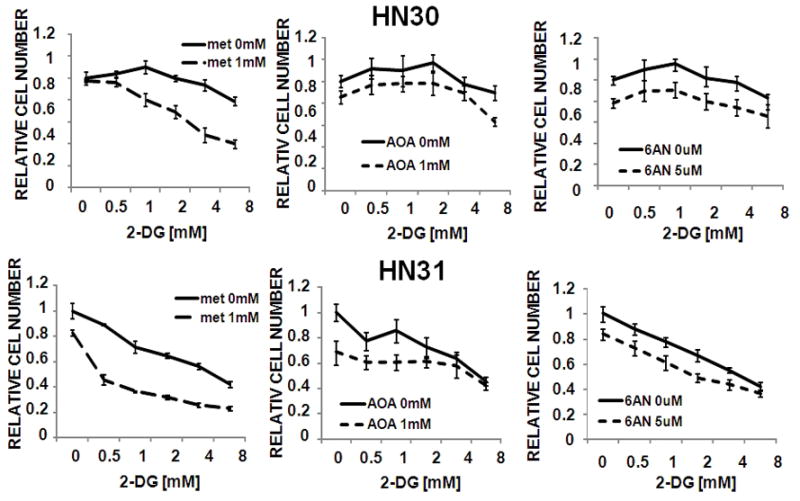
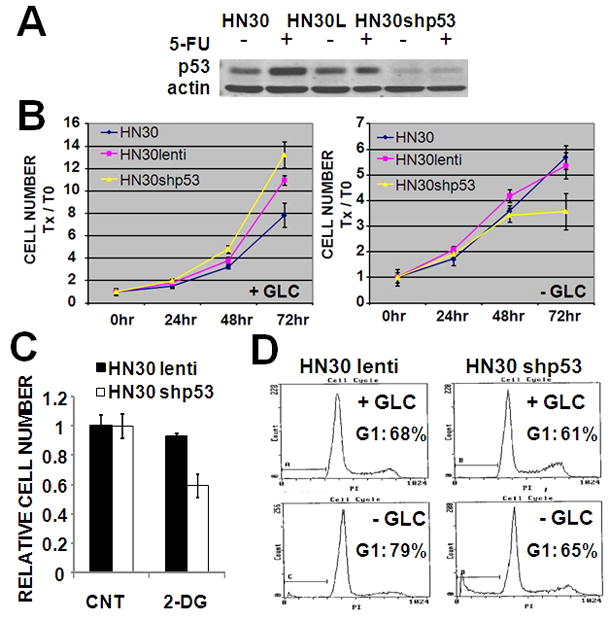
Results: HNSCC energy and reducing potential levels closely mirrored extracellular glucose concentrations. Glucose starvation induced cell death despite the activation of secondary energetic pathways. Conversely, glutamine was not required for HNSCC survival and did not serve as a significant source of energy. 2-deoxyglucose (2-DG) and its fluorinated derivative decreased glycolytic and Krebs cycle activity, cellular energy, and reducing potential and inhibited HNSCC cell proliferation. 2-DG effects were potentiated by the addition of metformin, but not by inhibitors of the pentose phosphate pathway or glutaminolysis. Despite dependence on glucose catabolism, the authors identified a subset of cell lines with relative resistance to starvation. Exploration of 1 such cell line (HN30) suggested that the presence of wild-type p53 can partially protect tumor cells from glucose starvation.

Conclusions: HNSCC tumor cells are dependent on glucose, not glutamine, for energy production and survival, providing a rationale for treatment strategies that target glucose catabolism. However, antimetabolic strategies may need to be tailored to the tumor background, more specifically, p53 status.


Figures

Figure 1
Figure 1. HNSCC cell lines require glucose and glutamine for maximal cell population growth
Cells proliferated in normal growth medium (DMEM) (A) or DMEM lacking either glutamine (B) or glucose (C). At indicated times the total DNA content of each well was assayed using a commercially available kit. Y- axis values are expressed as change in cell number at T= Xhr compared to T= 0hr. D) Cells were grown for 72hr in media lacking glucose or glutamine, supplemented with pyruvate. Live/dead cells were evaluated using Trypan blue exclusion. * indicates p<0.05. E) Cells were grown for 48hr in media lacking glucose or glutamine. Cells were collected and subjected to Annexin V PE/7AAD analysis in order to determine the early and late apoptotic as well as the necrotic fraction. Data are representative of multiple independent experiments.
Figure 2
Figure 2. HNSCC cell lines require glucose for survival
Cells were allowed to proliferate for 0–72hr in the presence or absence of glucose [25mM] and glutamine [4mM]. Cells were counted at each time point using Trypan blue to exclude non-viable cells. GLC = D-glucose [20mM], GLN = glutamine [4mM]. Representative images and cell counts are presented for FADU, a cell line sensitive to glucose withdrawal and PCI13, a cell line relatively resistant to glucose withdrawal.
Figure 3
Figure 3. Glucose is the primary source of reducing potential and ATP production in HNSCC cell lines
Cells were incubated in a salt solution containing increasing D-glucose (A) or glutamine (B) concentrations for 2hr, followed by a 2hr MTT reaction. C, Baseline reducing potential in 0mM and 25mM D-glucose (GLC) was normalized to total DNA content. D, ATP levels were measured and standardized to cell number.
Figure 4
Figure 4. Inhibition of glycolysis decreases HNSCC reducing potential, ATP levels and lactate production
(A) Cells were exposed to increasing concentrations of 2-DG or (B) 2-DG [12.5mM], 3-BP [50μM] and AOA [500μM] in the presence of 5mM D-glucose for 2hr (A), followed by a 2hr MTT reaction. (C) Cells were incubated in D-glucose [1mM] in the presence or absence of 2-DG [10mM] for 6hr followed by measurement of intra-cellular lactate levels (* represents p-value <0.05). (D) Intra-cellular ATP and reducing potential were measured following treatment of cells with 2-DG, 2-FG, 2-CG, 2-BG [25mM] in the presence of D-glucose [10mM] and pyruvate [20mM] for 2hr.
Figure 5
Figure 5. 2-DG triggers global metabolic changes
HN30 cells were deprived of glucose or treated with 2-DG [20mM] (in the presence of 25mM D-glucose containing DMEM) for 1, 4 or 8hours and analyzed for intra-cellular metabolite levels. (A) Data are expressed as ratios with the control condition as the denominator. Statistical significance (p-value < 0.05) is indicated by yellow text. Trends in metabolite levels are indicated by color (green= decrease, red= increase compared to control condition). General pathways are indicated to the right of the table. Inset graph illustrates intra-cellular 2-DG levels over time. Error bars indicate standard deviation. (B) Global pathway integration is illustrated in the accompanying diagram. Effects of treatment with 2-DG are indicated by green (decrease) and red (increase) arrows.
Figure 6
Figure 6. Inhibition of glycolysis reduces HNSCC proliferation and soft agar growth
(A) Cells were exposed to 2-DG [12.5mM], 3-BP [62.5μM] and AOA [500μM] for 72hr. Cell number was ascertained and presented relative to the control (media only) condition. (B–D) Following attachment, cells were exposed to increasing concentrations of 2-DG or 2-DG or 2-FG for 72hr. Cell number at the end of the experimental period was ascertained. IC50 values for at least 2 independent experiments were averaged. (E) Cells were seeded in 0.3% soft agar, incubated in either regular media (CNT) or media containing 2-DG [5mM] for 6 days, stained with crystal violet and counted. Representative images are presented in the inset. * represents p-value <0.05.
Figure 7
Figure 7. Metformin potentiates 2-DG effects on HNSCC proliferation
Cells were exposed to 2-DG in the presence or absence of metformin (met), aminooxyacetate (AOA) or 6-aminonicotinamide (6AN) for 72hr. Cell number was ascertained and presented relative to the control (media only) condition.
Figure 8
Figure 8. Loss of WTp53 abrogates glucose starvation induced G1 arrest and sensitizes HN30 cells
(A) Stable knockdown of WT (HN30shp53) was created. Stimulation with 5-FU (5ng/ml) for 24hr up-regulated expression of WTp53 in HN30 parental and HN30 lentivirus (HN30L) transfected cells. (B) Cells were grown in the presence or absence of glucose for 72hr. Total cell number was assayed at the end of the experimental period. (C) Cells were exposed to 2-DG [5mM] for 72hr. Total cell number was assayed at the end of the experimental period. (D) Cells were glucose starved for 36hr prior to cell cycle analysis using propidium iodide.

References

    1. Vander Heiden MG, Cantley LC, Thompson CB. Understanding the Warburg effect: the metabolic requirements of cell proliferation. Science. 2009;324(5930):1029–33. - PMC - PubMed
    1. DeBerardinis RJ, Mancuso A, Daikhin E, Nissim I, Yudkoff M, Wehrli S, et al. Beyond aerobic glycolysis: transformed cells can engage in glutamine metabolism that exceeds the requirement for protein and nucleotide synthesis. Proc Natl Acad Sci U S A. 2007;104(49):19345–50. - PMC - PubMed
    1. Wise DR, DeBerardinis RJ, Mancuso A, Sayed N, Zhang XY, Pfeiffer HK, et al. Myc regulates a transcriptional program that stimulates mitochondrial glutaminolysis and leads to glutamine addiction. Proc Natl Acad Sci U S A. 2008;105(48):18782–7. - PMC - PubMed
    1. Yuneva M, Zamboni N, Oefner P, Sachidanandam R, Lazebnik Y. Deficiency in glutamine but not glucose induces MYC-dependent apoptosis in human cells. J Cell Biol. 2007;178(1):93–105. - PMC - PubMed
    1. Pignon JP, le Maitre A, Maillard E, Bourhis J. Meta-analysis of chemotherapy in head and neck cancer (MACH-NC): an update on 93 randomised trials and 17,346 patients. Radiother Oncol. 2009;92(1):4–14. - PubMed

Publication types

MeSH terms