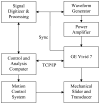
Implementation of vibro-acoustography on a clinical ultrasound system
- PMID: 21693399
- PMCID: PMC3138131
- DOI: 10.1109/TUFFC.2011.1927
Implementation of vibro-acoustography on a clinical ultrasound system
Abstract
Vibro-acoustography is an ultrasound-based imaging modality that uses two ultrasound beams of slightly different frequencies to produce images based on the acoustic response caused by harmonic ultrasound radiation force excitation at the difference frequency between the two ultrasound frequencies. Vibro-acoustography has demonstrated feasibility and usefulness in imaging of breast and prostate tissue. However, previous studies have been performed either in controlled water tank settings or a prototype breast scanner equipped with a water tank. To make vibro-acoustography more accessible and relevant to clinical use, we report here on the implementation of vibro-acoustography on a General Electric Vivid 7 ultrasound scanner. In this paper, we will describe software and hardware modifications that were performed to make vibro- acoustography functional on this system. We will discuss aperture definition for the two ultrasound beams and beamforming using a linear-array transducer. Experimental results from beam measurements and phantom imaging studies will be shown. The implementation of vibro-acoustography provides a step toward clinical translation of this imaging modality for applications in various organs including breast, prostate, thyroid, kidney, and liver.
Conflict of interest statement
Disclosure of Conflict of Interest: Mayo Clinic and some of the authors have a potential financial interest related to the technology referenced in this paper.
Figures


Similar articles
-
A beamforming study for implementation of vibro-acoustography with a 1.75-D array transducer.IEEE Trans Ultrason Ferroelectr Freq Control. 2013 Mar;60(3):535-51. doi: 10.1109/TUFFC.2013.2595. IEEE Trans Ultrason Ferroelectr Freq Control. 2013. PMID: 23475919 Free PMC article.
-
Image features in medical vibro-acoustography: in vitro and in vivo results.Ultrasonics. 2008 Nov;48(6-7):559-62. doi: 10.1016/j.ultras.2008.04.014. Epub 2008 May 25. Ultrasonics. 2008. PMID: 18599102 Free PMC article.
-
Stress field forming of sector array transducers for vibro-acoustography.IEEE Trans Ultrason Ferroelectr Freq Control. 2005 Nov;52(11):1943-51. doi: 10.1109/tuffc.2005.1561663. IEEE Trans Ultrason Ferroelectr Freq Control. 2005. PMID: 16422406
-
Critical issues in breast imaging by vibro-acoustography.Ultrasonics. 2006 Dec 22;44 Suppl 1:e217-20. doi: 10.1016/j.ultras.2006.06.021. Epub 2006 Jun 30. Ultrasonics. 2006. PMID: 16843513 Review.
-
Potential applications of vibro-acoustography in breast imaging.Technol Cancer Res Treat. 2005 Apr;4(2):151-8. doi: 10.1177/153303460500400204. Technol Cancer Res Treat. 2005. PMID: 15773784 Review.
Cited by
-
Complex background suppression for vibro-acoustography images.Ultrasonics. 2015 Feb;56:456-72. doi: 10.1016/j.ultras.2014.09.014. Epub 2014 Sep 30. Ultrasonics. 2015. PMID: 25304993 Free PMC article.
-
Pulsed Vibro-Acoustic Analysis Technique for Monitoring Bone Health in Preterm Infants: A Pilot Study.IEEE Access. 2024;12:106707-106719. doi: 10.1109/access.2024.3437375. Epub 2024 Aug 2. IEEE Access. 2024. PMID: 39148928 Free PMC article.
-
Ultrasound Radiation Force for the Assessment of Bone Fracture Healing in Children: An In Vivo Pilot Study.Sensors (Basel). 2019 Feb 24;19(4):955. doi: 10.3390/s19040955. Sensors (Basel). 2019. PMID: 30813465 Free PMC article.
-
Preliminary in vivo breast vibro-acoustography results with a quasi-2-d array transducer: a step forward.Ultrasound Med Biol. 2014 Dec;40(12):2819-29. doi: 10.1016/j.ultrasmedbio.2014.07.005. Ultrasound Med Biol. 2014. PMID: 25438862 Free PMC article.
-
A Review of Vibro-acoustography and its Applications in Medicine.Curr Med Imaging Rev. 2011 Nov 1;7(4):350-359. doi: 10.2174/157340511798038648. Curr Med Imaging Rev. 2011. PMID: 22423235 Free PMC article.
References
-
- Fatemi M, Greenleaf JF. Ultrasound-stimulated vibro-acoustic spectrography. Science. 1998 Apr 3;280:82–5. - PubMed
-
- Fatemi M, Manduca A, Greenleaf JF. Imaging elastic properties of biological tissues by low-frequency harmonic vibration. Proc IEEE. 2003 Oct;91:1503–1519.
-
- Alizad A, Wold LE, Greenleaf JF, Fatemi M. Imaging mass lesions by vibro-acoustography: modeling and experiments. IEEE Trans Med Imaging. 2004 Sep;23:1087–93. - PubMed
-
- Silva GT, Chen S, Frery AC, Greenleaf JF, Fatemi M. Stress field forming of sector array transducers for vibro-acoustography. IEEE Trans Ultrason Ferroelectr Freq Control. 2005 Nov;52:1943–51. - PubMed
Publication types
MeSH terms
Grants and funding
LinkOut - more resources
Full Text Sources
Other Literature Sources

