

Sources of image degradation in fundamental and harmonic ultrasound imaging: a nonlinear, full-wave, simulation study
- PMID: 21693410
- PMCID: PMC4443447
- DOI: 10.1109/TUFFC.2011.1938
Sources of image degradation in fundamental and harmonic ultrasound imaging: a nonlinear, full-wave, simulation study
Abstract
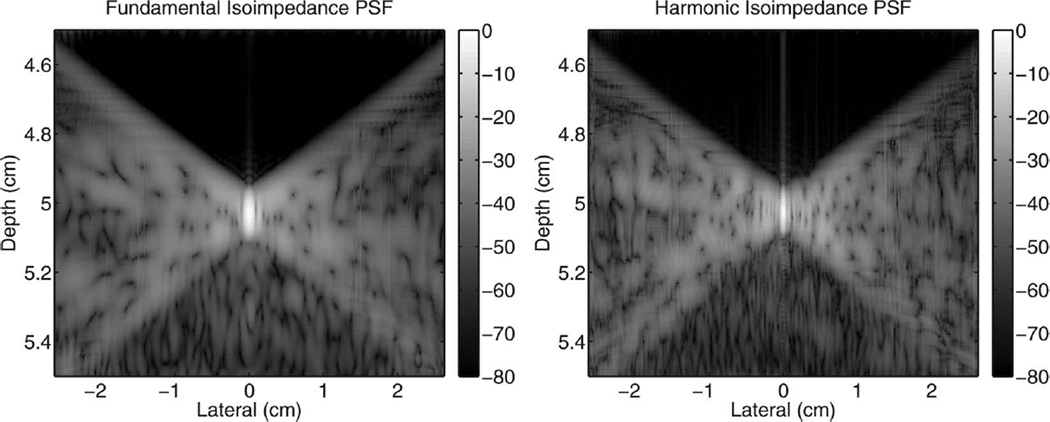
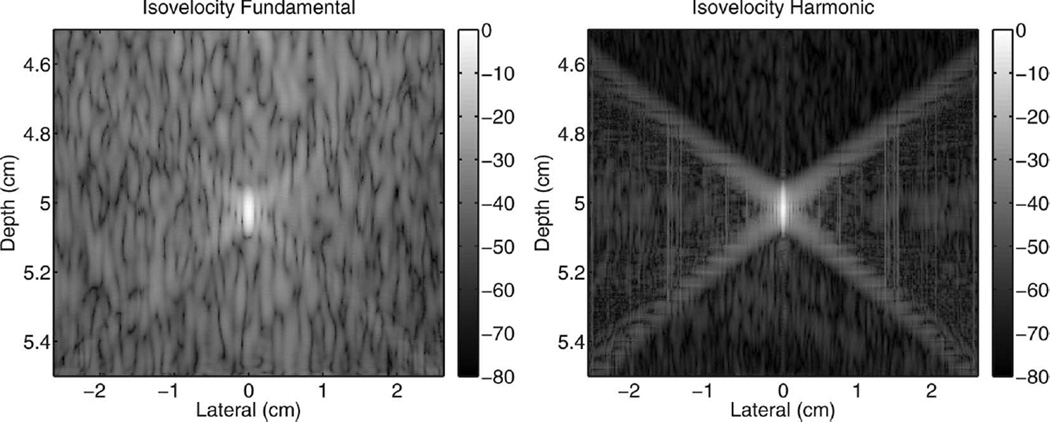
A full-wave equation that describes nonlinear propagation in a heterogeneous attenuating medium is solved numerically with finite differences in the time domain. This numerical method is used to simulate propagation of a diagnostic ultrasound pulse through a measured representation of the human abdomen with heterogeneities in speed of sound, attenuation, density, and nonlinearity. Conventional delay-and-sum beamforming is used to generate point spread functions (PSFs) that display the effects of these heterogeneities. For the particular imaging configuration that is modeled, these PSFs reveal that the primary source of degradation in fundamental imaging is due to reverberation from near-field structures. Compared with fundamental imaging, reverberation clutter in harmonic imaging is 27.1 dB lower. Simulated tissue with uniform velocity but unchanged impedance characteristics indicates that for harmonic imaging, the primary source of degradation is phase aberration.
Figures


Corrected and republished from
-
Sources of image degradation in fundamental and harmonic ultrasound imaging using nonlinear, full-wave simulations.IEEE Trans Ultrason Ferroelectr Freq Control. 2011 Apr;58(4):754-65. doi: 10.1109/TUFFC.2011.1868. IEEE Trans Ultrason Ferroelectr Freq Control. 2011. Corrected and republished in: IEEE Trans Ultrason Ferroelectr Freq Control. 2011 Jun;58(6):1272-83. doi: 10.1109/TUFFC.2011.1938. PMID: 21507753 Free PMC article. Corrected and republished.
References
-
- Tranquart F, Grenier N, Eder V, Pourcelot L. Clinical use of ultrasound tissue harmonic imaging. Ultrasound Med. Biol. 1999 Jul;25(6):889–894. - PubMed
-
- Thomas JD, Rubin DN. Tissue harmonic imaging: Why does it work? J. Am. Soc. Echocardiogr. 1998 Aug;11(8):803–808. - PubMed
-
- Humphrey VF. Nonlinear propagation in ultrasonic fields: Measurements, modelling, and harmonic imaging. Ultrasonics. 2000;38(1–8):267–272. - PubMed
-
- Choudhry S, Gorman B, Charboneau JW, Tradup DJ, Beck RJ, Kofler JM, Groth DS. Comparison of tissue harmonic imaging with conventional US in abdominal disease. Radiographics. 2000;20(4):1127–1135. - PubMed
Publication types
MeSH terms
Grants and funding
LinkOut - more resources
Full Text Sources
Miscellaneous
