. 2011 Sep 1;39(16):e110.
doi: 10.1093/nar/gkr504. Epub 2011 Jun 21.

Rational, modular adaptation of enzyme-free DNA circuits to multiple detection methods

Affiliations

Rational, modular adaptation of enzyme-free DNA circuits to multiple detection methods

Bingling Li et al. Nucleic Acids Res. .

Abstract

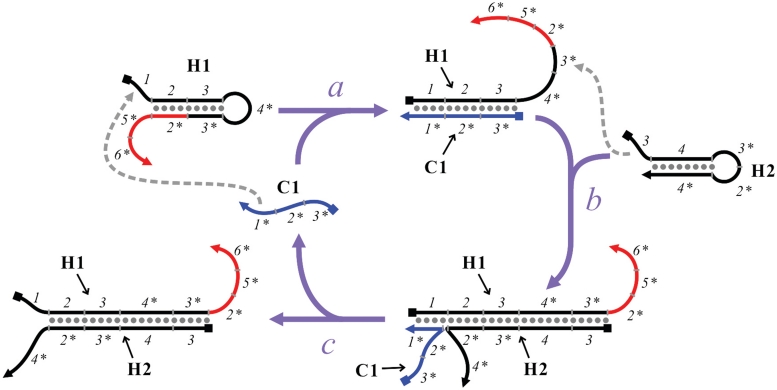
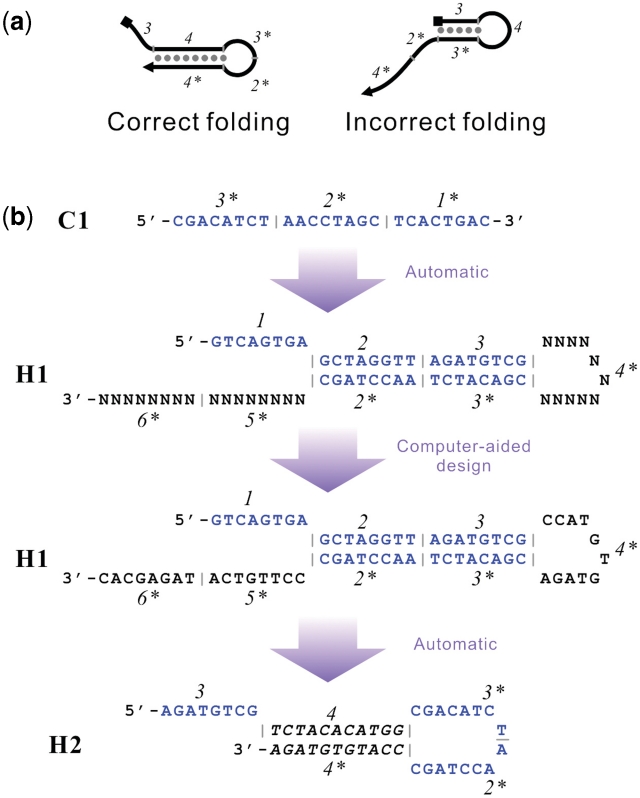
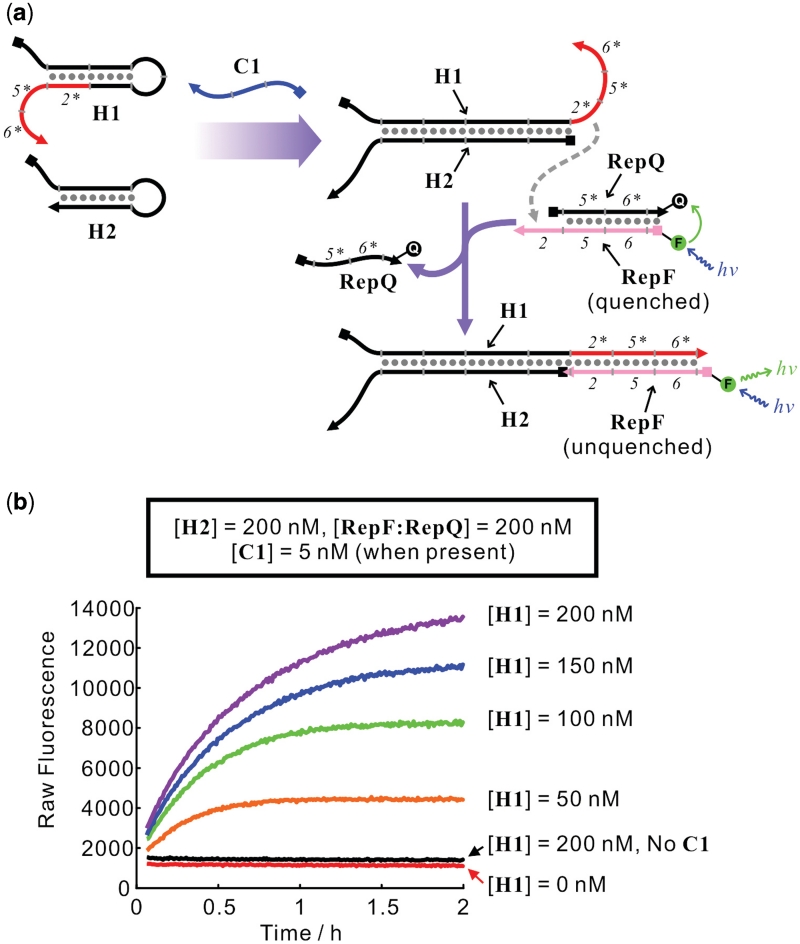
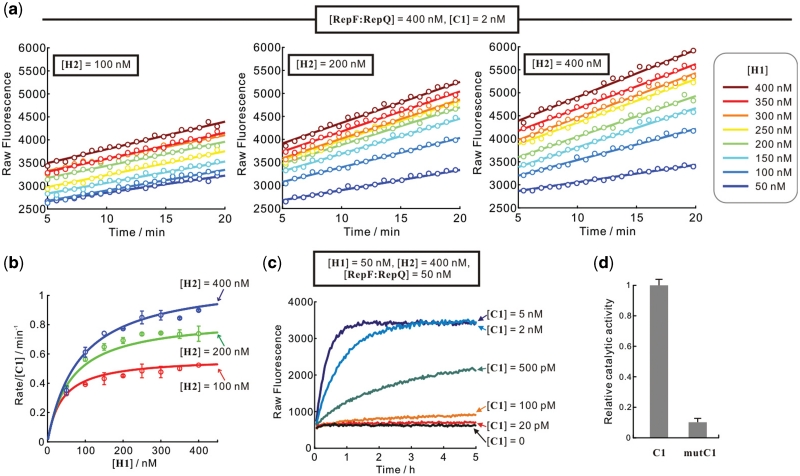
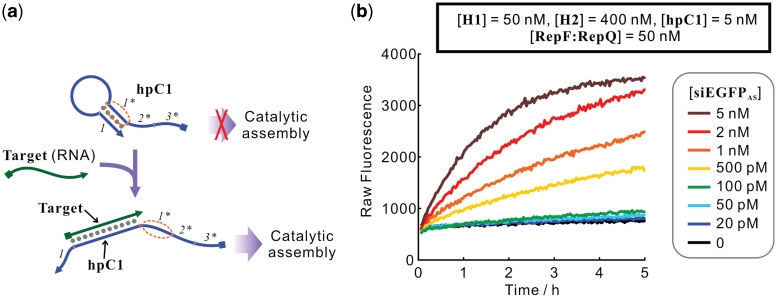
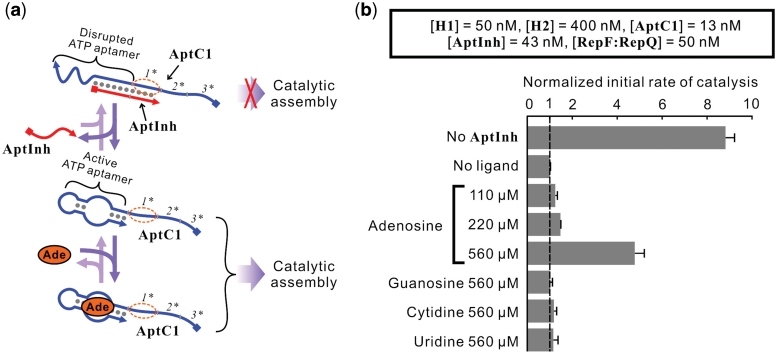
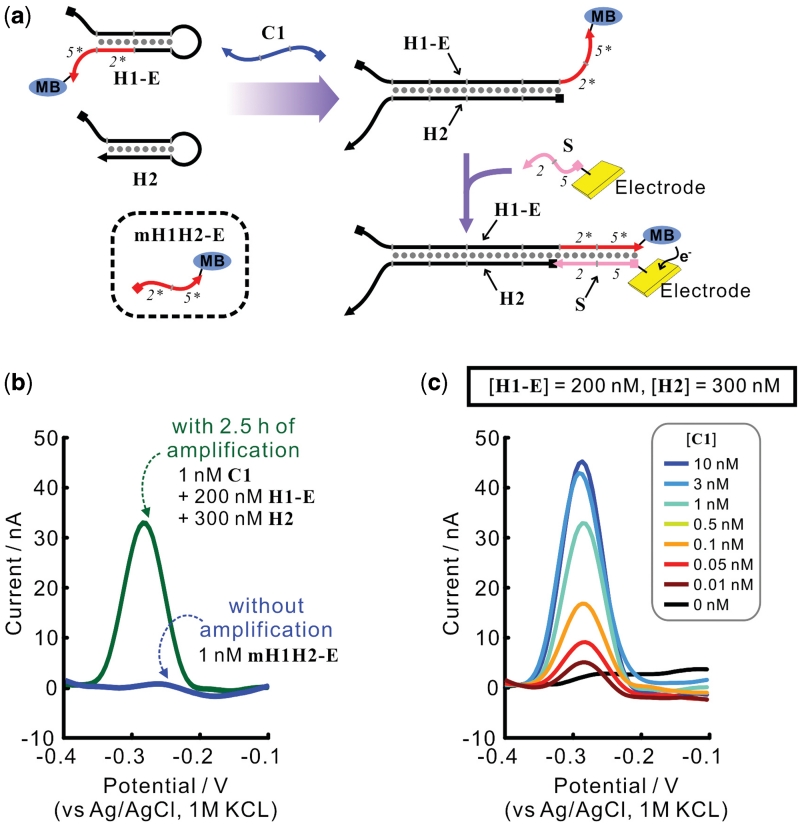
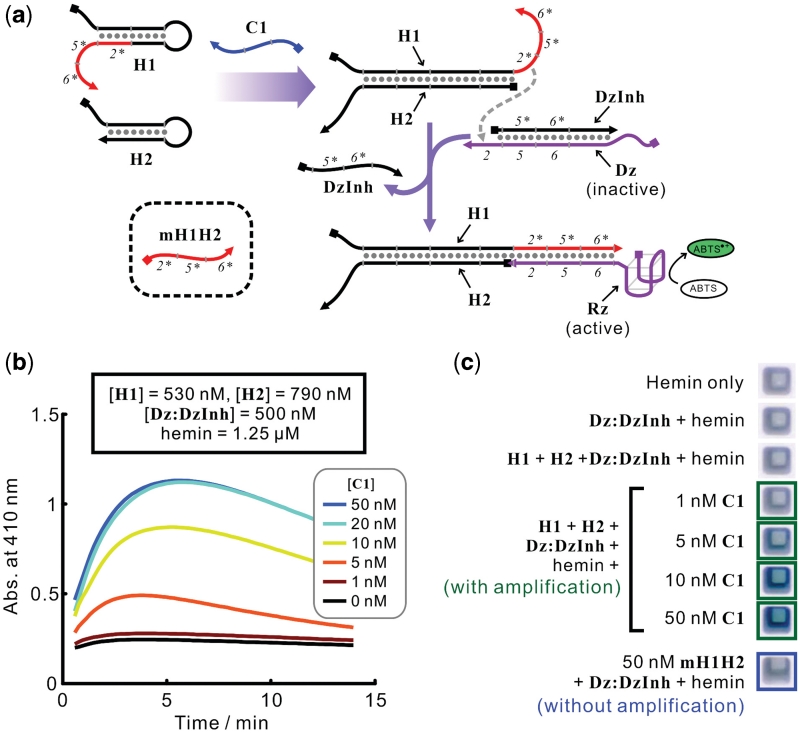
Signal amplification is a key component of molecular detection. Enzyme-free signal amplification is especially appealing for the development of low-cost, point-of-care diagnostics. It has been previously shown that enzyme-free DNA circuits with signal-amplification capacity can be designed using a mechanism called 'catalyzed hairpin assembly'. However, it is unclear whether the efficiency and modularity of such circuits is suitable for multiple analytical applications. We have therefore designed and characterized a simplified DNA circuit based on catalyzed hairpin assembly, and applied it to multiple different analytical formats, including fluorescent, colorimetric, and electrochemical and signaling. By optimizing the design of previous hairpin-based catalytic assemblies we found that our circuit has almost zero background and a high catalytic efficiency, with a k(cat) value above 1 min(-1). The inherent modularity of the circuit allowed us to readily adapt our circuit to detect both RNA and small molecule analytes. Overall, these data demonstrate that catalyzed hairpin assembly is suitable for analyte detection and signal amplification in a 'plug-and-play' fashion.


Figures

Figure 1.
Figure 1.
Scheme of catalyzed hairpin assembly. The ssDNA C1 catalyzes the hybridization of hairpins H1 and H2 through a series of toehold-mediated strand displacement reactions (a, b and c). Squares and arrows drawn on DNA strands represent 5′ termini and 3′ termini, respectively. Base-pairing is shown by gray, filled circles. Toehold binding is shown by dotted gray lines with arrows. Domains are named by numbers and complementarity is denoted by asterisks (see text). Junctions between domains are shown as short gray dashes. The segment of H1 that can trigger downstream sensors is shown in red.
Figure 2.
Figure 2.
Design of hairpins for catalyzed hairpin assembly. (a) The two possible conformations of H2. (b) Process of sequence design. The sequence of C1 was arbitrarily chosen. Domains whose sequence was defined by the sequence of C1 are shown in blue. New domains whose sequence was designed by NUPACK are shown in black.
Figure 3.
Figure 3.
Fluorescent reporter designed to monitor the kinetics of H1:H2 hybridization in real time. (a) Design of the fluorescent reporter. The reporter is a duplex consisting of a FAM-labeled strand RepF and an IowaBlack FQ-labeled strand RepQ. Hybridization of H1 and H2 exposes the domain 2* of H1, which leads to the toehold-mediated displacement of RepQ and an increase in fluorescent signal. (b) Real-time kinetics of H1:H2 assembly. The concentration of each species is shown in the panel. The concentrations of species common to all reactions are listed in the inset at the top of the panel.
Figure 4.
Figure 4.
Steady-state kinetics of H1:H2 hybridization and the sensitivity of the circuit. (a) Initial kinetics of H1:H2 hybridization when the concentration of H1 and H2 were systematically varied. The concentrations of H2 are shown in the inset of each plot. The concentrations of H1 are color-coded as shown in the legend box to the right. The concentrations of species common to all reactions are listed in the inset at the top of the panel. Circles and lines represent raw data and linear regressions, respectively. (b) The dependence of initial rate on the concentration of H1 and H2. Two independent readings were carried out for each combination of H1 and H2 [one is shown in (a)], and the standard deviations of the obtained rates are shown as error bars. (c) The sensitivity of the circuits. Different concentrations of C1 were added to H1, H2, RepF:RepQ and the raw fluorescence values produced are shown. (d) Sequence specificity of the circuit. MutC1, which varies from C1 by a C-to-A change at the second position (from the 5′ end) of the toehold region showed ∼10-fold lower activity than C1. In the presence of 50 nM [H1] and 400 nM [H2], the catalytic activities (rate/[catalyst]) of C1 and MutC1 were 0.35 min−1 and 0.03 min−1, respectively.
Figure 5.
Figure 5.
Detection of an RNA analyte. (a) Scheme of the molecular beacon-like signal transducer hpC1. (b) Performance of the signal transducer hpC1. Different concentrations of siEGFPAS were used as inputs for hpC1, followed by addition of H1, H2, and RepF:RepQ. The final concentration of each species is indicated in the panel.
Figure 6.
Figure 6.
Detection of a small molecule analyte. (a) Scheme of the aptamer-based transducer that enables the circuit to detect adenosine. AptInh reversibly binds and inhibits the adenosine binding and hairpin assembly functions of AptC1. Adenosine shifts the equilibrium of binding and favors folded, catalytic AptC1. (b) Performance of the signal transducer. Different concentrations of adenosine and control nucleosides were incubated with the AptC1:AptInh complex (AptInh in excess), followed by the addition of H1, H2, and RepF:RepQ. The initial rates of catalysis were normalized to that of the reaction in which no nucleoside was added. In this reaction, the initial rate was 0.045 ± 0.01 nM min−1, whereas the initial rate of the reaction in the absence of AptInh (‘No AptInh’) was 0.39 ± 0.02 nM min−1. These two rates frame the dynamic range of this assay. The final concentration of each species is indicated in the panel.
Figure 7.
Figure 7.
Electrochemical readout of the circuit. (a) Scheme of the electrochemical readout. The domain 6* of H1 was truncated and the 3′ terminus of the truncated H1 was modified with a methylene blue (MB) moiety, to make H1-E. The H1-E:H2 complex (but not H1-E alone) can stably bind the surface of an electrode modified with strand S, leading to the detection of MB. (b) The amplification effect of the circuit, shown by the comparison between the MB-derived electrochemical (SWV) signal elicited by 1 nM mH1H2-E (blue line), and that elicited by 1 nM C1 along with the circuit. (c) The electrochemical (SWV) signal elicited by different concentrations of C1 with the circuit.
Figure 8.
Figure 8.
Colorimetric readout of the circuit. (a) Scheme of the colorimetric readout. The colorimetric reporter is made by the hybridization of Dz and DzInh. H1:H2 can displace DzInh from Dz, allowing the DNAzyme portion of Dz to fold into an active conformation and thereby catalyze the conversion of the colorless substrate ABTS to the green product ABTS•+ in the presence of hemin and H2O2. (b) Kinetics of formation of ABTS•+. All concentrations are listed as they were before the addition of hemin and H2O2. (c) The amplification effect of the circuit, shown by the comparison between the colorimetric signal elicited by 50 nM mH1H2 (the well with a blue outline), and that elicited by 1–50 nM C1 with the circuit (the wells with a green outline).

Similar articles

Cited by

References

    1. Adler M, Wacker R, Niemeyer CM. Sensitivity by combination: immuno-PCR and related technologies. Analyst. 2008;133:702–718. - PubMed
    1. Niemeyer CM, Adler M, Wacker R. Detecting antigens by quantitative immuno-PCR. Nat. Protoc. 2007;2:1918–1930. - PubMed
    1. Zhao W, Ali MM, Brook MA, Li Y. Rolling circle amplification: applications in nanotechnology and biodetection with functional nucleic acids. Angew. Chem. Int. Ed. Engl. 2008;47:6330–6337. - PubMed
    1. Cho EJ, Yang L, Levy M, Ellington AD. Using a deoxyribozyme ligase and rolling circle amplification to detect a non-nucleic acid analyte, ATP. J. Am. Chem. Soc. 2005;127:2022–2023. - PubMed
    1. Gullberg M, Fredriksson S, Taussig M, Jarvius J, Gustafsdottir S, Landegren U. A sense of closeness: protein detection by proximity ligation. Curr. Opin. Biotechnol. 2003;14:82–86. - PubMed

Publication types