. 2011 Sep 1;39(17):7775-90.
doi: 10.1093/nar/gkr487. Epub 2011 Jun 21.

Overlapping signals for translational regulation and packaging of influenza A virus segment 2

Affiliations

Overlapping signals for translational regulation and packaging of influenza A virus segment 2

Helen M Wise et al. Nucleic Acids Res. .

Abstract

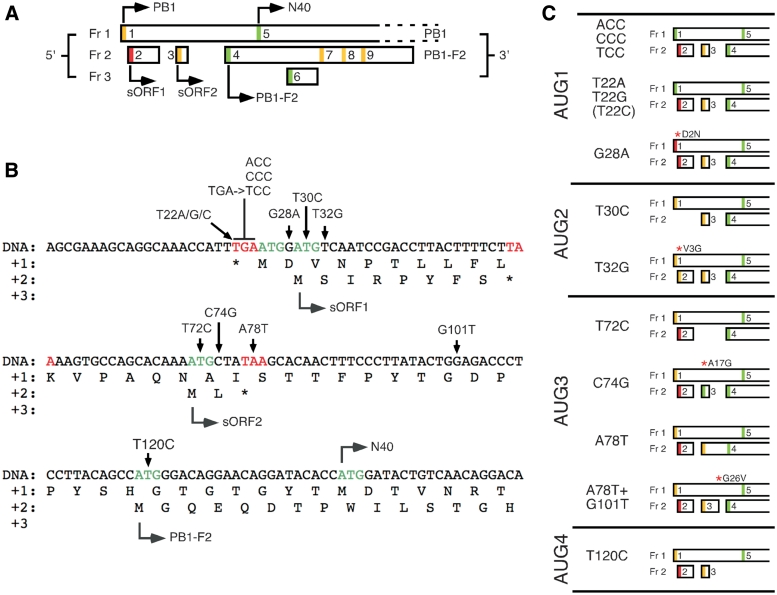
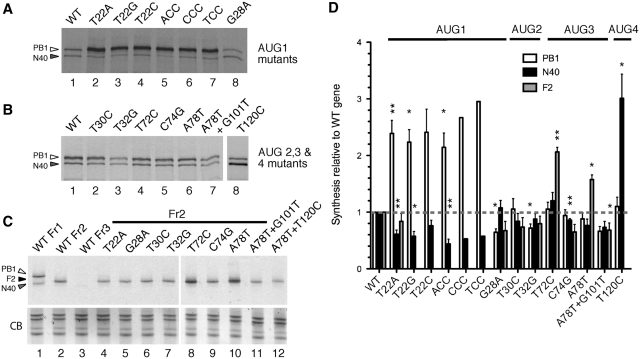
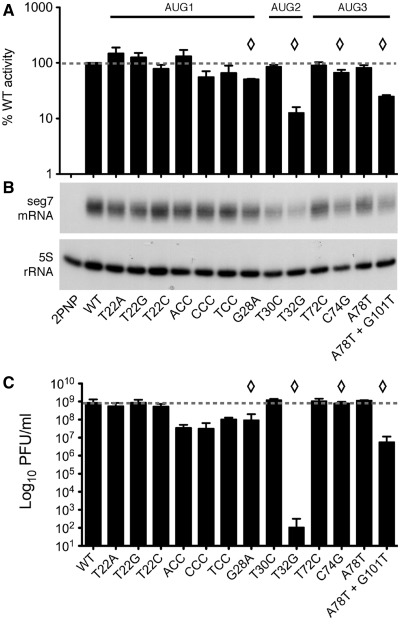
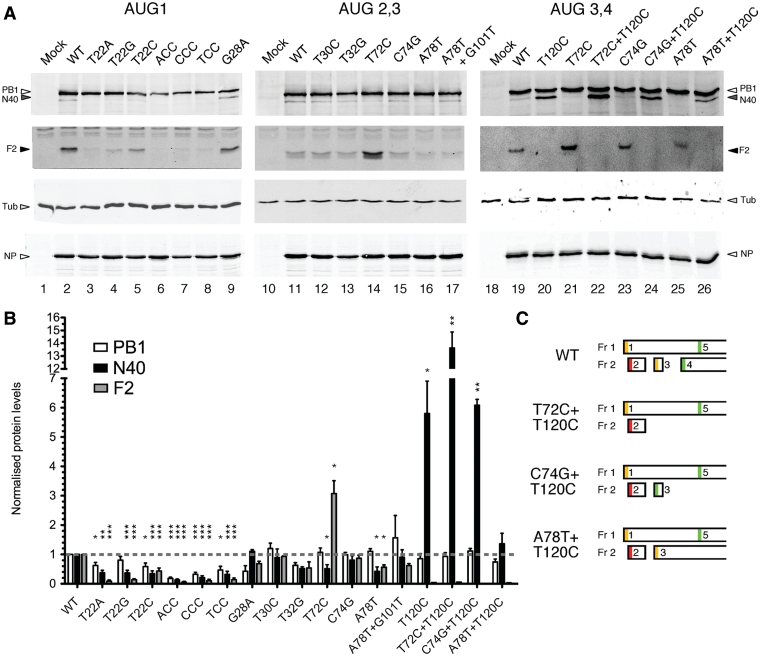
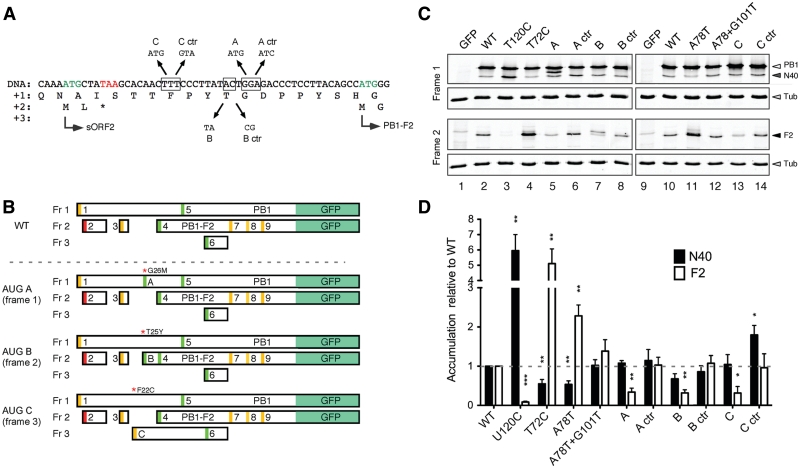
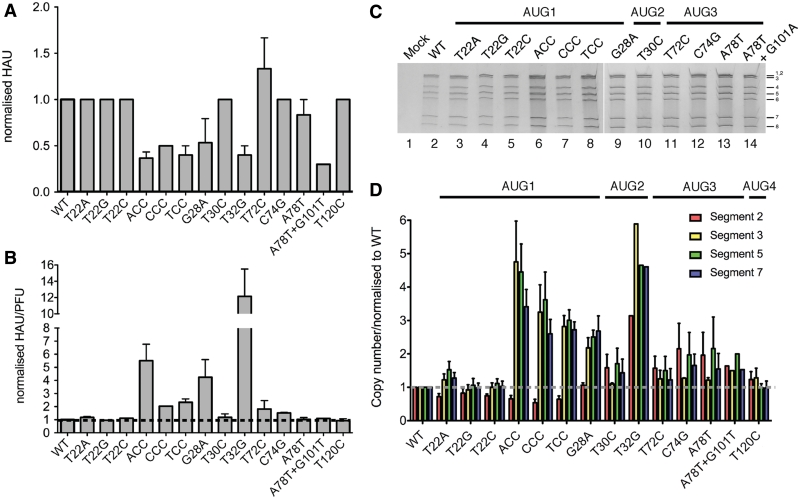
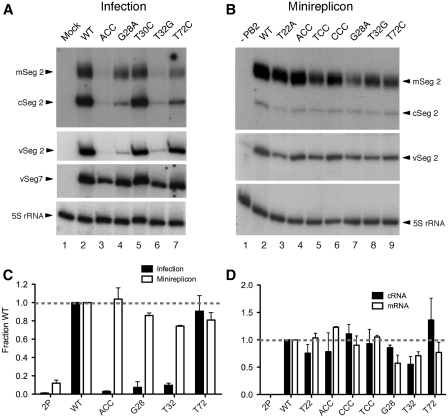
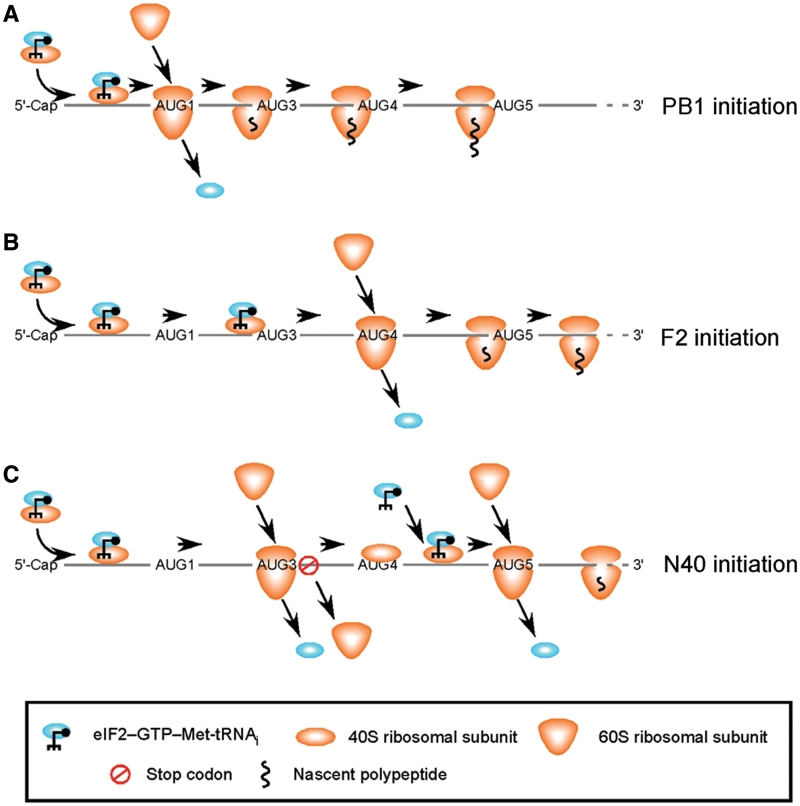
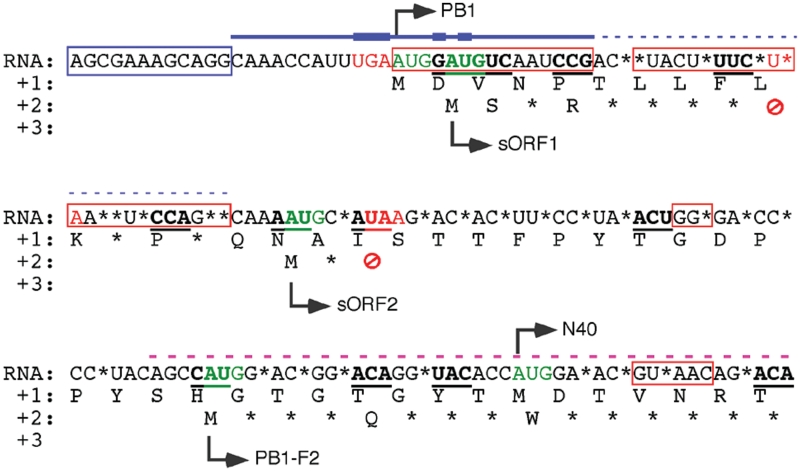
Influenza A virus segment 2 mRNA expresses three polypeptides: PB1, PB1-F2 and PB1-N40, from AUGs 1, 4 and 5 respectively. Two short open reading frames (sORFs) initiated by AUGs 2 and 3 are also present. To understand translational regulation in this system, we systematically mutated AUGs 1-4 and monitored polypeptide synthesis from plasmids and recombinant viruses. This identified sORF2 as a key regulatory element with opposing effects on PB1-F2 and PB1-N40 expression. We propose a model in which AUGs 1-4 are accessed by leaky ribosomal scanning, with sORF2 repressing synthesis of downstream PB1-F2. However, sORF2 also up-regulates PB1-N40 expression, most likely by a reinitiation mechanism that permits skipping of AUG4. Surprisingly, we also found that in contrast to plasmid-driven expression, viruses with improved AUG1 initiation contexts produced less PB1 in infected cells and replicated poorly, producing virions with elevated particle:PFU ratios. Analysis of the genome content of virus particles showed reduced packaging of the mutant segment 2 vRNAs. Overall, we conclude that segment 2 mRNA translation is regulated by a combination of leaky ribosomal scanning and reinitiation, and that the sequences surrounding the PB1 AUG codon are multifunctional, containing overlapping signals for translation initiation and for segment-specific packaging.


Figures

Figure 1.
Figure 1.
Arrangement and sequence of ORFs in the 5′-end of segment 2 mRNA and mutants used in this study. (A) Schematic diagram of ORFs at the 5′-end of segment 2 mRNA with AUG codons numbered according to their position and shaded according to the strength of their Kozak consensus sequence (green, strong consensus, with A/G at −3 and G at +4; yellow, medium consensus with either A/G at −3 or G at +4; red is a weak consensus U at –3 and +4). Adapted from (7). (B) Nucleotide sequence and site of mutations used in this study. The 5′-end of segment 2 mRNA is shown in positive sense and as cDNA, since all mutations were introduced into a plasmid clone of the segment. (C) Summary of the predicted effect of the mutations used in this study on AUG strength and ORF structure (non synonymous changes in PB1 are indicated after red asterisks).
Figure 2.
Figure 2.
Expression of segment 2 polypeptides in vitro. SDS–PAGE and autoradiographic analysis of aliquots of rabbit reticulocyte lysate supplemented with 35S-Methionine programmed with (A, B) full length clones of WT or mutant segment 2 clones as indicated or (C) segment 2 clones fused to the CAT gene in frames 1, 2 or 3 as shown. The migration of polypeptides of interest is indicated. The lower panel in (C) shows a portion of the gel stained with Coomassie Blue dye (CB) as a loading control. (D) Levels of PB1, PB1-N40 and PB1-F2 were quantified by densitometry and normalized to those of the WT construct. The mean ± SEM [n ≥ 3, with the exception of T22C (n = 2), TCC and CCC (n = 1)] are plotted. Asterisks indicate levels of significance based on P-values from a one sample t-test with the test value set to 1; *P < 0.05; **P < 0.01; ***P < 0.001.
Figure 3.
Figure 3.
Transcriptional activity and growth properties of the mutant segment 2 PB1 proteins and virus. (A, B) 293T cells were transfected with plasmids encoding PB2, PA, NP, and WT or mutant PB1 proteins (or as a negative control, lacking PB1; 2PNP), along with (A) a synthetic vRNA analogue containing a luciferase gene and the luciferase activity determined 48 h later or (B) a plasmid expressing authentic segment 7 vRNA followed by reverse transcriptase-primer extension analysis of segment 7 mRNA accumulation or (as a loading control), 5S rRNA. The data in (A) are the mean ± SEM of 4–6 independent experiments performed in duplicate, normalized to the values obtained using WT PB1. Mutants with non-synonymous changes in PB1 are indicated with diamonds. (C) The indicated viruses were rescued in 293T cells and amplified in MDCK cells before being titred by plaque assay on MDCK cells. Data shown are the mean ± SEM of at least two independent rescues.
Figure 4.
Figure 4.
Expression of segment 2 polypeptides in virus-infected cells. (A) Lysates harvested at 8 h post-infection from MDCK cells infected (or mock infected) with the indicated viruses were analysed by SDS–PAGE and western blotting for the indicated proteins. Tubulin was used as a loading control. (B) Levels of PB1, PB1-N40 and PB1-F2 were quantified using LiCOR software and normalized to levels from WT infected cells. The mean ± SEM from at least two independent experiments are shown. (C) Predicted ORF structure of viruses with alterations to AUG3/sORF2 and AUG4 are shown. Asterisks indicate levels of significance based on P-values from a one sample t-test with the test value set to 1; *P < 0.05; P < 0.01; ***P < 0.001.
Figure 5.
Figure 5.
Effect of novel AUG codons on expression of segment 2 polypeptides after plasmid transfection. (A) Sequence of mutations introduced between sORF2 and AUG4. (B) Diagrammatic summary of the predicted ORF structure of plasmids encoding fusions between the 5′-end of segment 2 and GFP in either frame 1 or frame 2. (C) Lysates from 293T cells harvested 48 h after transfection with the indicated plasmids infected were analysed by SDS–PAGE and western blotting for GFP. Tubulin was used as a loading control. (D) Levels of PB1-, PB1-N40- and PB1-F2-GFP fusion proteins were quantified using LiCOR software and normalized to levels from WT infected cells. The mean ± SEM from at least three independent experiments are shown. Asterisks indicate levels of significance based on P-values from a one sample t-test with the test value set to 1; *P < 0.05; **P < 0.01; ***P < 0.001.
Figure 6.
Figure 6.
Particle:PFU ratio and vRNA content of WT and mutant virus particles. (A) Virus release was measured by HA assay. Values are plotted after normalization with respect to WT virus and are the mean ± SEM of at least two independent isolations, with the exception of T22G, T22C, CCC and A78T+G101T, which were only analysed once. (B) The ratio (normalized with respect to the WT virus) of HAU:PFU values are plotted, to provide a measure of the proportion of infectious virus particles. (C and D) RNA was extracted from equal PFU of the indicated viruses and (C) analysed by urea–PAGE and silver staining. The migration of individual segments is indicated. (D) Extracted RNA was analysed by one step qRT–PCR for segments 2, 3, 5 and 7. The copy numbers obtained for the mutant viruses were normalized to that of the WT virus to derive a relative segment copy number:PFU ratio. Data plotted are the mean ± SEM from at least two independent extractions, and for each extraction, the qRT–PCR reaction was performed in triplicate, with the exception of T32G and A78T+G101T, where RNA was extracted from a single rescue (the mean of triplicate determinations is plotted).
Figure 7.
Figure 7.
Accumulation of viral RNA in infected and transfected cells. Total cellular RNA extracted from 293T cells was analysed by reverse-transcriptase primer extension with radiolabelled oligonucleotides specific for the indicated RNAs followed by urea–PAGE and autoradiography. (A) RNA was harvested at 9 h post-infection from cells infected (or mock infected) with the indicated viruses. (B) RNA was extracted from cells 48 h after transfection with plasmids to recreate viral RNPs around the indicated segment 2 vRNAs. Lane 1 shows the background levels of vRNA produced from the segment 2 plasmid by cellular RNA PolI in the absence of a full viral polymerase complex. (C and D) Accumulation of the indicated RNAs was quantified by densitometry and normalized to the value obtained with the WT after correction with respect to the 5S ribosomal RNA loading control. The mean ± range of two independent experiments are plotted.
Figure 8.
Figure 8.
Model for translation of segment 2 polypeptides. PB1 translation occurs by canonical initiation at the first AUG. The majority of PB1-F2 translation occurs via leaky scanning to bypass AUGs 1–3. In contrast, reinitiation after termination at the end of sORF2 is a major contributor to PB1-N40 translation. See text for further details.
Figure 9.
Figure 9.
Functional constraints on the 5′-end of segment 2. The 5′-end sequences (mRNA sense) of segment 2 are shown. Asterisks denote residues conserved in <95% of isolates. AUG codons are highlighted in green, stop codons in red and the beginning of ORFs are shown by arrows. Underlined codons in bold are those with evidence of RNA-level conservation (41). The blue box indicates the conserved promoter sequence, red boxes indicate PB1 sequences known from mutagenic and/or structural evidence to be important for polymerase function. The blue line indicates sequences important for segment-specific vRNA packaging, with the thick lines showing data from this study (Figure 6), medium weight from (38) and thin dashed line from (39). The purple dashed line indicates a region suggested to contain a human T-cell epitope (49).

Similar articles

Cited by

References

    1. Portela A, Digard P. The influenza virus nucleoprotein: a multifunctional RNA-binding protein pivotal to virus replication. J. Gen. Virol. 2002;83:723–734. - PubMed
    1. Neumann G, Brownlee GG, Fodor E, Kawaoka Y. Orthomyxovirus replication, transcription, and polyadenylation. Curr. Top. Microbiol. Immunol. 2004;283:121–143. - PubMed
    1. Hutchinson EC, von Kirchbach JC, Gog JR, Digard P. Genome packaging in influenza A virus. J. Gen. Virol. 2010;91:313–328. - PubMed
    1. Taubenberger JK, Kash JC. Influenza virus evolution, host adaptation, and pandemic formation. Cell Host Microbe. 2010;7:440–451. - PMC - PubMed
    1. Naffakh N, Tomoiu A, Rameix-Welti MA, van der Werf S. Host restriction of avian influenza viruses at the level of the ribonucleoproteins. Annu. Rev. Microbiol. 2008;62:403–424. - PubMed

Publication types

MeSH terms