

Imaging in acute stroke
West J Emerg Med.
2011 Feb.
Abstract
Imaging in the acute setting of suspected stroke is an important topic to all emergency physicians, neurologists, neurosurgeons and neuroradiologist. When it comes to imaging, the American College of Radiology (ACR) continually updates its guidelines for imaging pathways through the ACR Appropriateness Criteria.1,2 This article is a general review of the imaging modalities currently used to assess and help guide the treatment of strokes.
Figures
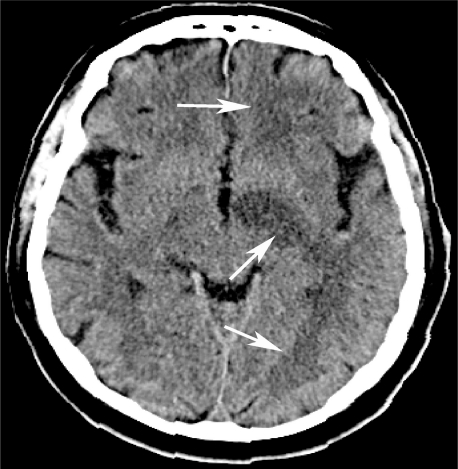
Left middle cerebral artery (MCA) infarction. Axial nonenhanced computer tomography demonstrates hypoattenuating foci throughout the left sided white matter (arrows) and sulcal effacement in the left MCA territory, consistent with infarction.
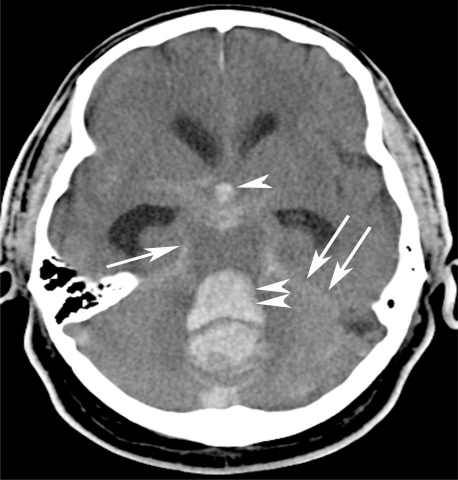
Massive subarachnoid and intraventricular hemorrhage. Axial nonenhanced computer tomography demonstrates a large “bright” or hyper attenuating dense subarachnoid hemorrhage throughout the perimesencephalic cistern (arrow) and along the tentorium (double arrows). The subarachnoid blood in the basilar cisterns has refluxed into the 4th (double arrowheads) and 3rd (arrowhead) ventricles. There is marked hydrocephalus. An arterio-venous malformation (please refer to Figure 8), was the etiology of this subarachnoid hemorrhage.
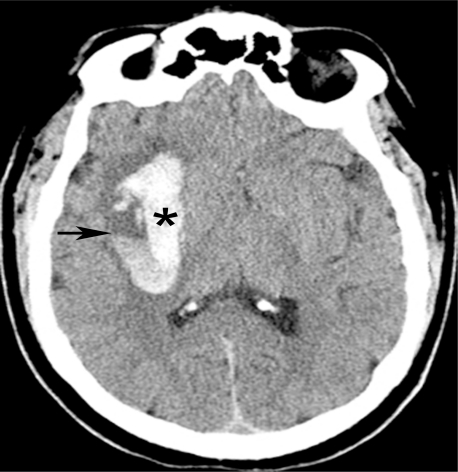
Hypertensive intraparenchymal hematoma. Nonenhanced computed tomography shows a large right basal ganglionic hematoma (*) containing a fluid/fluid level (arrow).
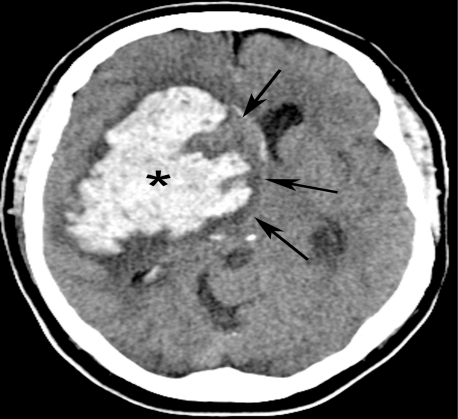
Hypertensive intraparenchymal hematoma with subfalcine herniation. Nonenhanced axial computed tomography demonstrates a large right basal ganglionic hypertensive bleed (*) with mass effect and midline shift or a subfalcine herniation to the left (arrows). The frontal horns are part of the lateral ventricles. The right frontal horn is compressed so severely that it is almost completely obliterated. Dilation of the left frontal horn is due to obstructive hydrocephalus – a consequence of compression of the third ventricle.

Hypertensive intraparenchymal hematoma with subfalcine herniation. Coronal two-dimensional reconstruction from a computed tomography angiogram demonstrates transfalcine herniation (arrows) to the left due to large right sided intraparenchymal hemorrhage. Same patient as Figure 4.
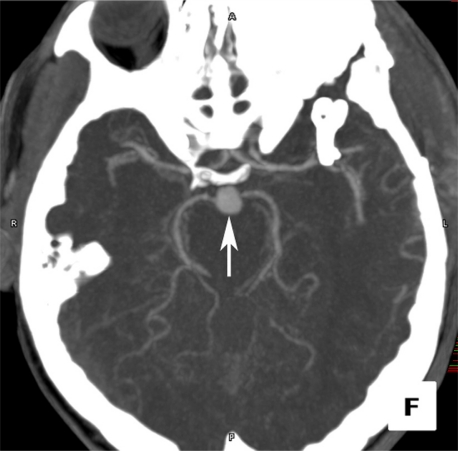
Basilar tip artery aneurysm. Computed tomography angiogram in the axial projection demonstrates a focal basilar tip artery aneurysm (arrow).
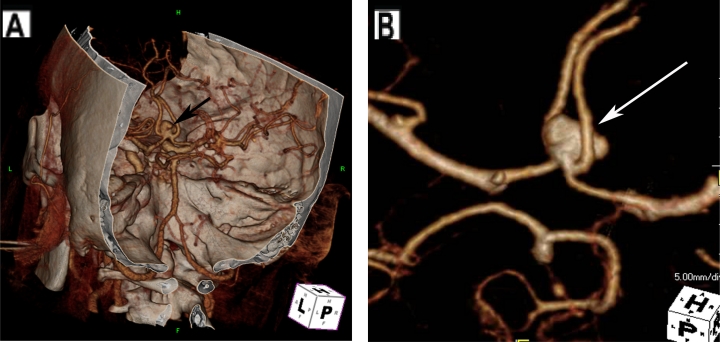
Anterior communicating artery (ACoA) aneurysm. (A) Cerebal computed tomography angiogram (CTA) in three-dimensional projection with skull surface overlay demonstrates an anterior communicating artery aneurysm. (B) Dedicated images from CTA of the Circle of Willis isolates the aneurysm (arrow).
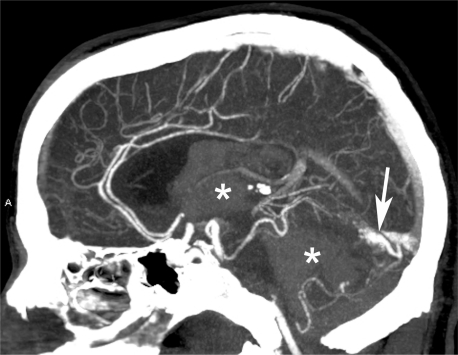
Subarachnoid and intraventricular hemorrhage due to vascular malformation. Sagital reformatted images from computed tomography angiogram demonstrates the enhancing vascular malformation (arrow), which was the etiology of the intraventricular hemorrhage (same patient in Figure 2).
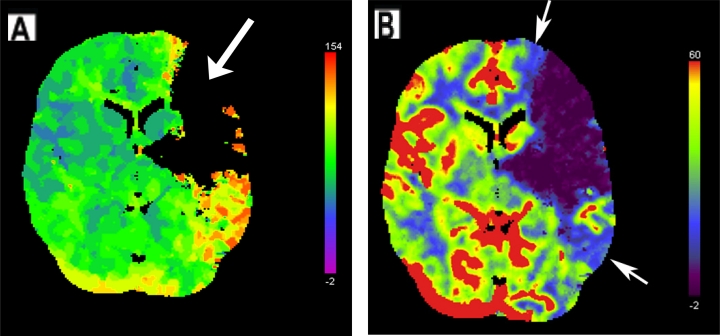
Left middle cerebral artery infarct. (A) Regional cerebral blood flow map from computed tomography perfusion shows a large perfusion defect in the left frontal and temporal lobes, evidenced by a lack of color display. (B) Regional cerebral blood volume map demonstrates a penumbra of decreased perfusion (indicated with arrows around blue areas) surrounding the defect (purple), indicating potentially reversible ischemia about the perfusion defect.
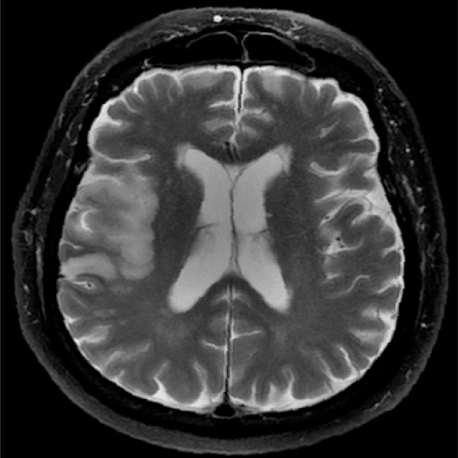
Right middle cerebral artery infarction. Fast spin echo T2-weighted fat suppressed image demonstrates increased signal intensity and effacement of the right temporal lobe, consistent with sub-acute infarct.
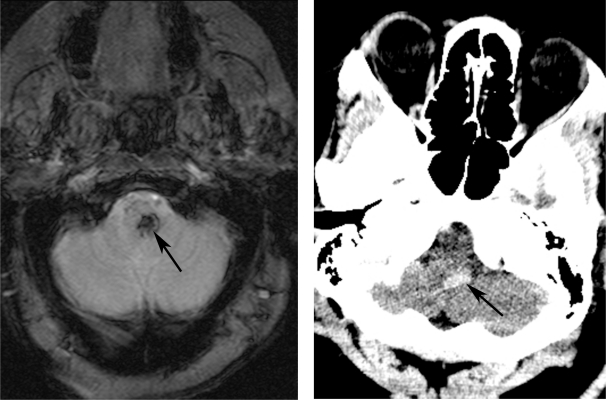
Hemorrhagic brainstem infarct. (A) Gradient echo axial magnetic resonance image depicts a focus of hypointensity due to paramagnetic effect of the hemosiderin, otherwise known as “blooming.” (B) Axial computed tomography through the brainstem demonstrates a corresponding hyperattenuating focus of hemorrhage (arrow) in the brainstem.
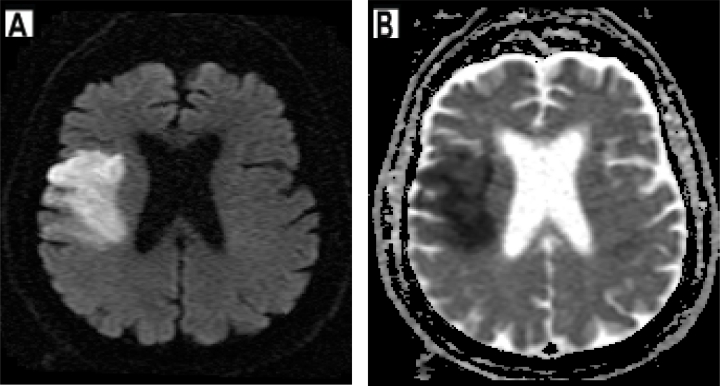
Right middle cerebral artery infarction. (A and B) Restricted water diffusion in the region of infarct results in an increased signal intensity on diffusion-weighted imaging (A) and decreased signal on apparent diffusion coefficient imaging (B).
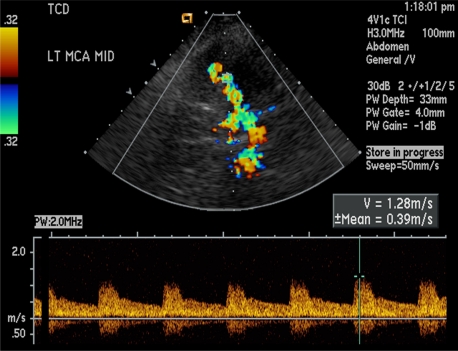
Normal transcranial Doppler. Color Doppler imaging of the left middle cerebral artery demonstrates normal flow and waveforms, with a peak velocity of 1.28 m/s.
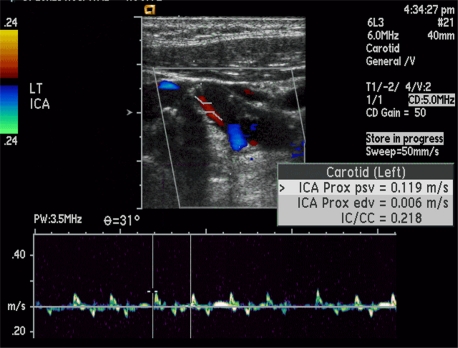
Acute high-grade internal carotid artery (ICA) occlusion. Longitudinal color Doppler image through the internal carotid artery demonstrates a “string” sign, with very minimal flow through the ICA.
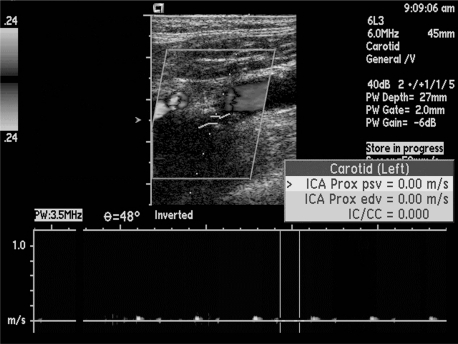
Acute complete internal carotid artery occlusion. Longitudinal sonogram of the left internal carotid artery demonstrates complete flow void, with no perceptible waveforms.
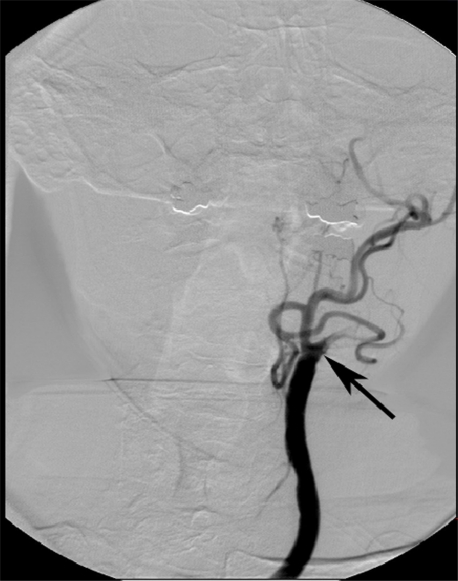
Internal carotid artery occlusion. Frontal projection from left cerebral angiogram delineates complete occlusion of the left internal carotid artery to the level of the common carotid artery (arrow). Note the normal opacification of the external carotid artery branches.
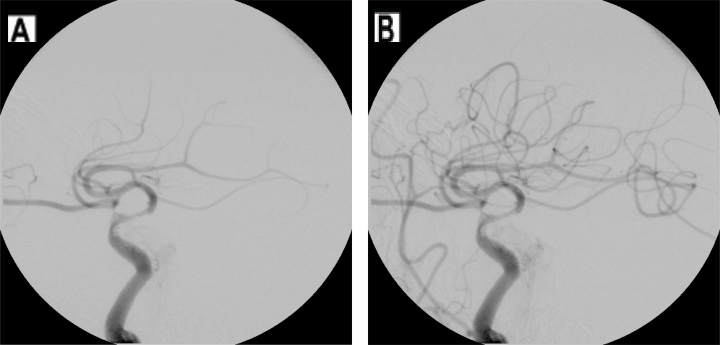
Left middle cerebral artery (MCA) recanalization. (A) Initial lateral image from cerebral angiogram demonstrates a paucity of vessels in the MCA distribution. (B) Repeat lateral angiogram after intra-arterial lysis demonstrates recanalization of flow and normalized perfusion.
References
-
- American College of Radiology . ACR; Reston, VA: 2009. ACR Appropriateness Criteria “Headache”. www.acr.org/ac.
-
- American College of Radiology . ACR; Reston, VA: 2009. ACR Appropriateness Criteria “Cerebrovascular Disease”. www.acr.org/ac.
-
- Schwartz DT. Emergency Radiology:Case Studies. McGraw Hill; 2008. pp. 501–522.
-
- Civetta, Kirby, Taylor, et al. 4th Edition. Lippencott: Williams and Wilkins; 2009. Critical Care; pp. 368–382.