. 2011;6(6):e21138.
doi: 10.1371/journal.pone.0021138. Epub 2011 Jun 17.

MRI pattern recognition in multiple sclerosis normal-appearing brain areas

Affiliations

MRI pattern recognition in multiple sclerosis normal-appearing brain areas

Martin Weygandt et al. PLoS One. 2011.

Abstract

Objective: Here, we use pattern-classification to investigate diagnostic information for multiple sclerosis (MS; relapsing-remitting type) in lesioned areas, areas of normal-appearing grey matter (NAGM), and normal-appearing white matter (NAWM) as measured by standard MR techniques.

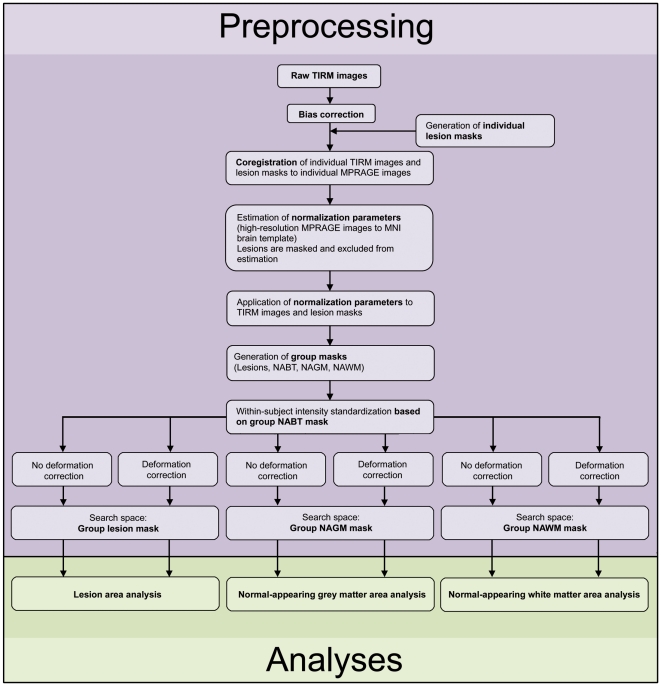
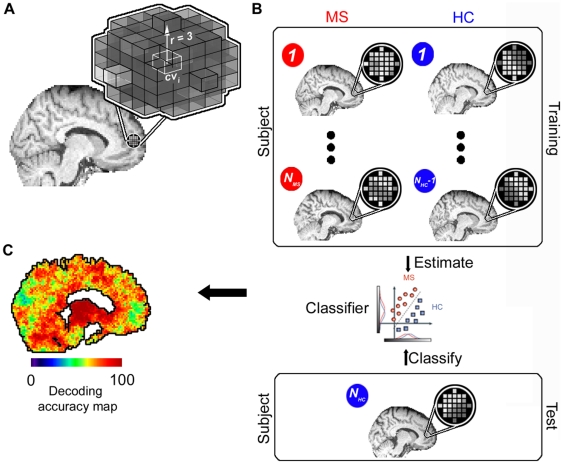
Methods: A lesion mapping was carried out by an experienced neurologist for Turbo Inversion Recovery Magnitude (TIRM) images of individual subjects. Combining this mapping with templates from a neuroanatomic atlas, the TIRM images were segmented into three areas of homogenous tissue types (Lesions, NAGM, and NAWM) after spatial standardization. For each area, a linear Support Vector Machine algorithm was used in multiple local classification analyses to determine the diagnostic accuracy in separating MS patients from healthy controls based on voxel tissue intensity patterns extracted from small spherical subregions of these larger areas. To control for covariates, we also excluded group-specific biases in deformation fields as a potential source of information.

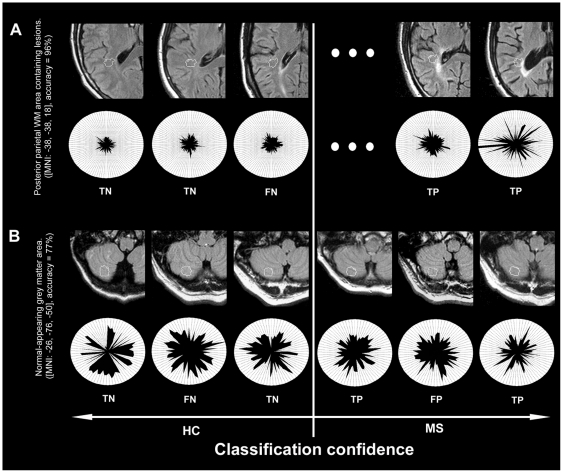
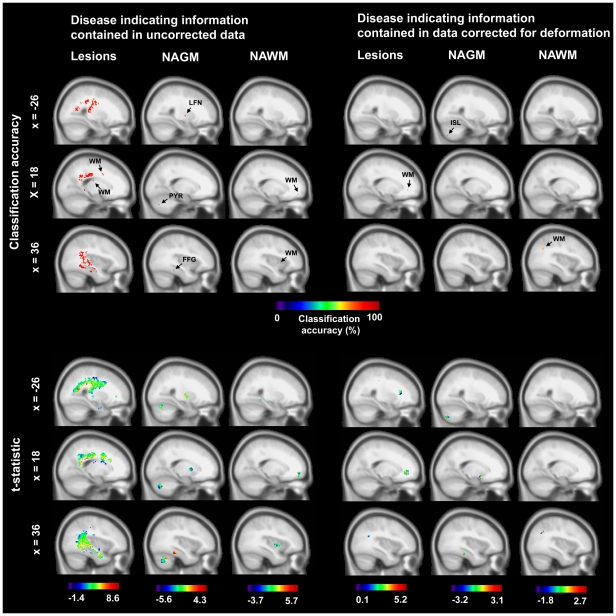
Results: Among regions containing lesions a posterior parietal WM area was maximally informative about the clinical status (96% accuracy, p<10(-13)). Cerebellar regions were maximally informative among NAGM areas (84% accuracy, p<10(-7)). A posterior brain region was maximally informative among NAWM areas (91% accuracy, p<10(-10)).

Interpretation: We identified regions indicating MS in lesioned, but also NAGM, and NAWM areas. This complements the current perception that standard MR techniques mainly capture macroscopic tissue variations due to focal lesion processes. Compared to current diagnostic guidelines for MS that define areas of diagnostic information with moderate spatial specificity, we identified hotspots of MS associated tissue alterations with high specificity defined on a millimeter scale.


Conflict of interest statement

Competing Interests: The authors have declared that no competing interests exist.

Figures

Figure 1
Figure 1. Overview of data processing.
For details please see text and Material S1. MNI, Montreal Neurological Institute; NAGM, normal­appearing grey matter; NAWM, normal-appearing white matter; NABT, normal-appearing brain tissue.
Figure 2
Figure 2. Mapping of brain regions with diagnostic information.
(A) ‘Searchlight’ approach that searches across the brain for local tissue intensity patterns that are informative about the clinical condition (MS, healthy control [HC]). For a given ‘center’ voxel cvi in the brain the searchlight is defined as a spherical cluster with a radius of three voxels surrounding the center coordinate. Thus, a searchlight contained 123 spherically arranged voxels if the minimal distance to the boundary of the search space was at least three voxels. However, when the center voxel was located closer to a boundary of the search space of a given analysis the searchlight could deviate from the spherical shape and contain less voxels in order to guarantee that only voxels belonging to the supposed tissue class were contained in searchlights in a given analysis. (B) Within this cluster of voxels the spatial pattern of intensities is extracted for each subject separately. The data from all (Ntotal  =  NMS + NHC) but one subject (Ntotal­1) are used as a ‘training dataset’ to train a classifier to distinguish between patterns from the two groups. The classifier is then tested by applying it to the data from the remaining ‘test’ subject (in this example NHC). This leave­one­out (LOO) cross­validation procedure was then repeated n­times by leaving out the data of one subject at a time from the training data set. The success of the classifier is an estimate of the local information at that position in the brain. (C) The resulting accuracy was then noted at the coordinate cvi as the local information related to the clinical condition. By iterating this procedure across different positions in the brain it is possible to obtain a map of diagnostic accuracies for each coordinate cvi, depicting the diagnostic information contained in local patterns in decoding the clinical condition.
Figure 3
Figure 3. Image features with information on the clinical status.
In order to provide insights into pathology indicating MR image features we depict exemplary searchlight classifiers in the native space of individual subjects, i.e. their native TIRM images (0.5×0.5×3 mm voxel resolution) and highlight the pattern structure of selected subjects. (A) Posterior parietal white matter searchlight that obtained maximal accuracy in the lesion area analysis for uncorrected data (96%, p<10­13). Top row: Outer contour lines correspond to the border of searchlights. Inner contour lines correspond to the voxel in the respective searchlight that was most important for the multivariate decision process. The sorting of individual images from left to right follows the diagnoses of the classifiers (left: images that were diagnosed as controls, right; images that were diagnosed as patients; eccentricity follows diagnostic confidence). Bottom row: Polar plot of the tissue intensity patterns drawn from the voxels located in this area in the normalized TIRM images of individual subjects (2×2×2 mm voxel resolution), sorted clockwise by the relevance of a voxel for the classification in descending order. The plot suggests that the classifier grounds its decisions mainly on a set of hyperintense voxels in patients that are distributed across the searchlight. (B) Searchlight of maximal accuracy in the NAGM area analysis based on data corrected for deformation effects. The TIRM image characteristics and the polar plot depicted underline the capability of the pattern recognition approach to identify disease indicating information from brain tissue characteristics ‘invisible’ to the human eye. TP, true positive; TN, true negative; FP, false positive; FN, false negative.
Figure 4
Figure 4. Brain regions with information on the clinical status.
Top: Center coordinates of searchlight classifiers with above­chance accuracy in the separation of patients and controls. Bottom: Tissue intensity differences between patients and controls for voxels underlying significant searchlight classifiers (t­statistic; MS minus control). Left: Analysis based on raw data. Right: Analysis is based on data corrected for deformation. FFG, fusiform gyrus; ISL, inferior semi-lunar lobule; LFN, lentiform nucleus; PYR, pyramis; WM, white matter.

References

    1. McDonald WI, Compston A, Edan G, Goodkin D, Hartung HP, et al. Recommended diagnostic criteria for multiple sclerosis: guidelines from the International Panel on the diagnosis of multiple sclerosis. Ann Neurol. 2001;50:121–127. - PubMed
    1. Polman CH, Wolinsky JS, Reingold SC. Multiple sclerosis diagnostic criteria: three years later. Mult Scler. 2005;11:5–12. - PubMed
    1. Montalban X, Tintoré M, Swanton J, Barkhof F, Fazekas F, et al. MRI criteria for MS in patients with clinically isolated syndromes. Neurology. 2010;74:427–434. - PubMed
    1. Chard DT, Griffin CM, Rashid W, Davies GR, Altmann DR, et al. Progressive grey matter atrophy in clinically early relapsing-remitting multiple sclerosis. Mult Scler. 2004;10:387–391. - PubMed
    1. Valsasina P, Benedetti B, Rovaris M, Sormani MP, Comi G, et al. Evidence for progressive gray matter loss in patients with relapsing­remitting MS. Neurology. 2005;65:1126–1128. - PubMed

Publication types