

Life course trajectories of systolic blood pressure using longitudinal data from eight UK cohorts
- PMID: 21695075
- PMCID: PMC3114857
- DOI: 10.1371/journal.pmed.1000440
Life course trajectories of systolic blood pressure using longitudinal data from eight UK cohorts
Abstract
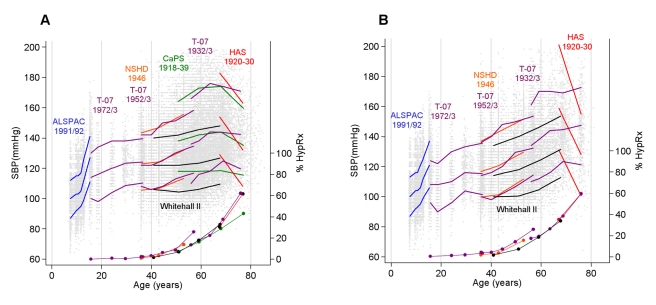
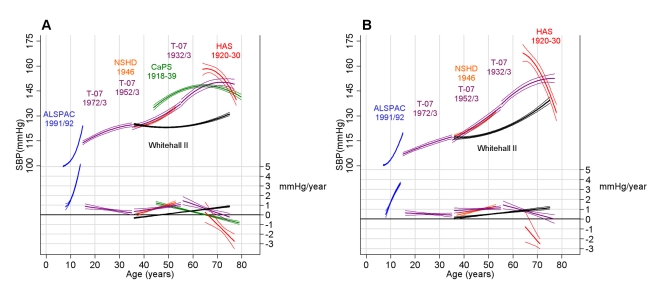
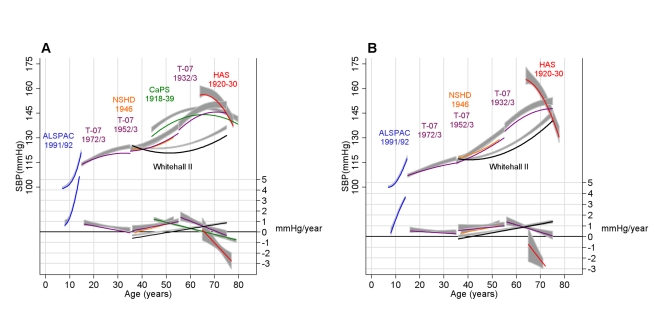
Background: Much of our understanding of the age-related progression of systolic blood pressure (SBP) comes from cross-sectional data, which do not directly capture within-individual change. We estimated life course trajectories of SBP using longitudinal data from seven population-based cohorts and one predominantly white collar occupational cohort, each from the United Kingdom and with data covering different but overlapping age periods.
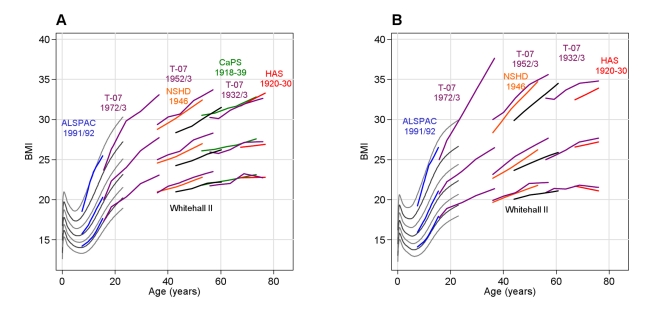
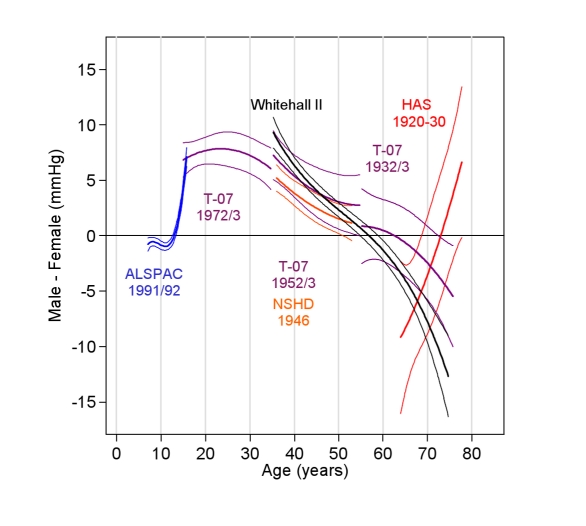
Methods and findings: Data are from 30,372 individuals and comprise 102,583 SBP observations spanning from age 7 to 80+y. Multilevel models were fitted to each cohort. Four life course phases were evident in both sexes: a rapid increase in SBP coinciding with peak adolescent growth, a more gentle increase in early adulthood, a midlife acceleration beginning in the fourth decade, and a period of deceleration in late adulthood where increases in SBP slowed and SBP eventually declined. These phases were still present, although at lower levels, after adjusting for increases in body mass index though adulthood. The deceleration and decline in old age was less evident after excluding individuals who had taken antihypertensive medication. Compared to the population-based cohorts, the occupational cohort had a lower mean SBP, a shallower annual increase in midlife, and a later midlife acceleration. The maximum sex difference was found at age 26 (+8.2 mm Hg higher in men, 95% CI: 6.7, 9.8); women then experienced steeper rises and caught up by the seventh decade.
Conclusions: Our investigation shows a general pattern of SBP progression from childhood in the UK, and suggests possible differences in this pattern during adulthood between a general population and an occupational population. Please see later in the article for the Editors' Summary.
Conflict of interest statement
The authors have declared that no competing interests exist.
Figures
References
-
- Lewington S, Clarke R, Qizilbash N, Peto R, Collins R. Age-specific relevance of usual blood pressure to vascular mortality: a meta-analysis of individual data for one million adults in 61 prospective studies. Lancet. 2002;360:1903–1913. - PubMed
-
- Paffenbarger RS, Jr, Wing AL. Chronic disease in former college students. X. The effects of single and multiple characteristics on risk of fatal coronary heart disease. Am J Epidemiol. 1969;90:527–535. - PubMed
-
- Miura K, Daviglus ML, Dyer AR, Liu K, Garside DB, et al. Relationship of blood pressure to 25-year mortality due to coronary heart disease, cardiovascular diseases, and all causes in young adult men: the Chicago Heart Association Detection Project in Industry. Arch Intern Med. 2001;161:1501–1508. - PubMed
-
- McCarron P, Smith GD, Okasha M, McEwen J. Blood pressure in young adulthood and mortality from cardiovascular disease. Lancet. 2000;355:1430–1431. - PubMed
Publication types
MeSH terms
Grants and funding
- MC_UP_A620_1015/MRC_/Medical Research Council/United Kingdom
- G19/35/MRC_/Medical Research Council/United Kingdom
- G0100222/MRC_/Medical Research Council/United Kingdom
- MC_U123092721/MRC_/Medical Research Council/United Kingdom
- U.1052.00.013.00001/MRC_/Medical Research Council/United Kingdom
- R01HL036310-20A2/HL/NHLBI NIH HHS/United States
- WBS U.1052.00.013.00003/MRC_/Medical Research Council/United Kingdom
- MC_UP_A540_1021/MRC_/Medical Research Council/United Kingdom
- R01 HL036310/HL/NHLBI NIH HHS/United States
- G0600705/MRC_/Medical Research Council/United Kingdom
- MC_U105292687/MRC_/Medical Research Council/United Kingdom
- WBS U.1300.00.006/MRC_/Medical Research Council/United Kingdom
- 092731/WT_/Wellcome Trust/United Kingdom
- G8802774/MRC_/Medical Research Council/United Kingdom
- G0902037/MRC_/Medical Research Council/United Kingdom
- PHSRN29/MRC_/Medical Research Council/United Kingdom
- RG/07/008/23674/BHF_/British Heart Foundation/United Kingdom
- WBS U.1300.80.001.00001/MRC_/Medical Research Council/United Kingdom
LinkOut - more resources
Full Text Sources
