. 2011;6(6):e20903.
doi: 10.1371/journal.pone.0020903. Epub 2011 Jun 9.

Phos-tag-based analysis of myosin regulatory light chain phosphorylation in human uterine myocytes

Affiliations

Phos-tag-based analysis of myosin regulatory light chain phosphorylation in human uterine myocytes

Hector N Aguilar et al. PLoS One. 2011.

Abstract

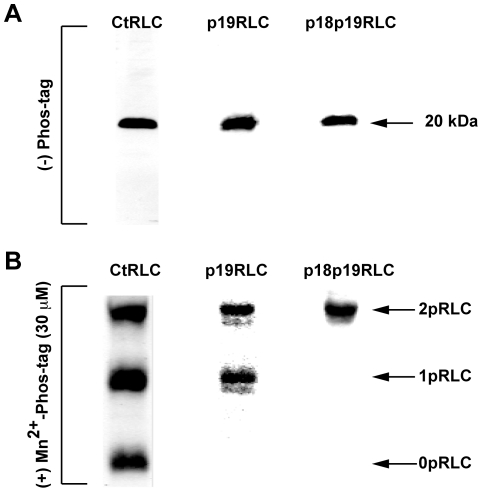
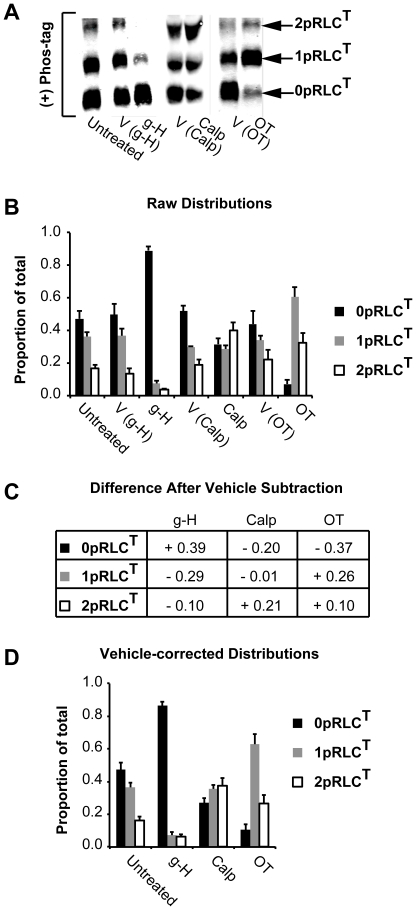
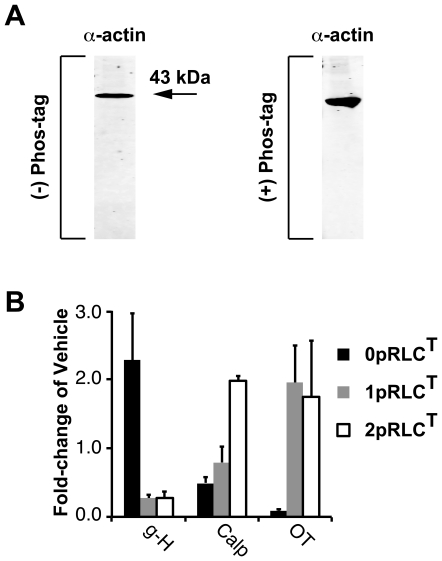
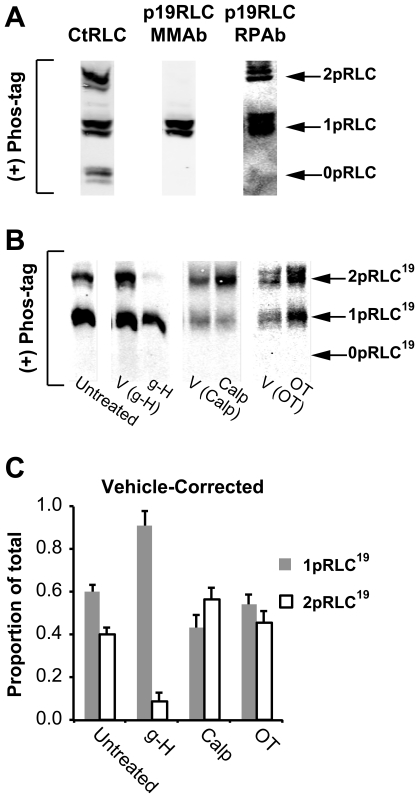
Background: The 'phosphate-binding tag' (phos-tag) reagent enables separation of phospho-proteins during SDS-PAGE by impeding migration proportional to their phosphorylation stoichiometry. Western blotting can then be used to detect and quantify the bands corresponding to the phospho-states of a target protein. We present a method for quantification of data regarding phospho-states derived from phos-tag SDS-PAGE. The method incorporates corrections for lane-to-lane loading variability and for the effects of drug vehicles thus enabling the comparison of multiple treatments by using the untreated cellular set-point as a reference. This method is exemplified by quantifying the phosphorylation of myosin regulatory light chain (RLC) in cultured human uterine myocytes.

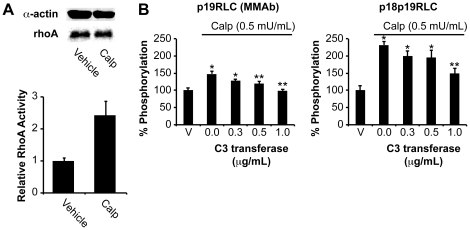
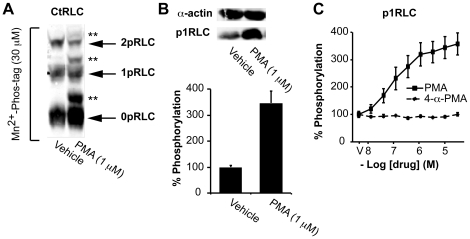
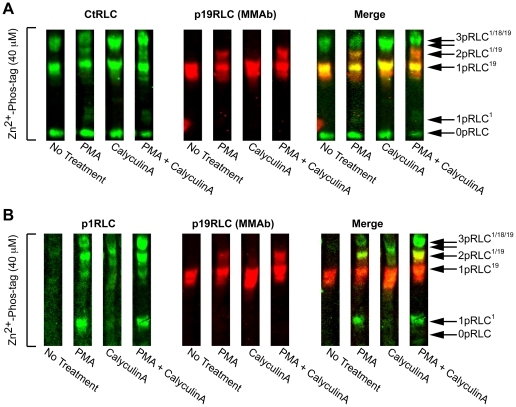
Methodology/principal findings: We have evaluated and validated the concept that, when using an antibody (Ab) against the total-protein, the sum of all phosphorylation states in a single lane represents a 'closed system' since all possible phospho-states and phosphoisotypes are detected. Using this approach, we demonstrate that oxytocin (OT) and calpeptin (Calp) induce RLC kinase (MLCK)- and rho-kinase (ROK)-dependent enhancements in phosphorylation of RLC at T18 and S19. Treatment of myocytes with a phorbol ester (PMA) induced phosphorylation of S1-RLC, which caused a mobility shift in the phos-tag matrices distinct from phosphorylation at S19.

Conclusion/significance: We have presented a method for analysis of phospho-state data that facilitates quantitative comparison to a reference control without the use of a traditional 'loading' or 'reference' standard. This analysis is useful for assessing effects of putative agonists and antagonists where all phospho-states are represented in control and experimental samples. We also demonstrated that phosphorylation of RLC at S1 is inducible in intact uterine myocytes, though the signal in the resting samples was not sufficiently abundant to allow quantification by the approach used here.


Conflict of interest statement

Competing Interests: The authors have declared that no competing interests exist.

Figures

Figure 1
Figure 1. Demonstration of RLC phospho-states in human uterine myocyte lysates.
A. WBs produced by separation of proteins in lysates from unstimulated uterine myocytes by traditional SDS-PAGE. Single lanes were loaded with ∼25 µg of protein/lane. Abs directed against the C- terminus of total-RLC (CtRLC), phospho-S19-RLC (p19RLC), and diphospho-T18/S19-RLC (p18p19RLC) identify a single prominent band of 20 kDa. B. WBs produced after Mn2+-phos-tag SDS-PAGE. CtRLC, p19RLC, and p18p19RLC Abs identified three, two, and one specific band(s), respectively. The lower, middle, and upper bands in these blots correspond to non-, mono-, and di-phosphorylated RLC, denoted as 0pRLC, 1pRLC, and 2pRLC.
Figure 2
Figure 2. Validation of increased rhoA activity and phosphorylation of RLC by calpeptin.
A. Estimation of GTP-bound ‘active’ rhoA in uterine myocytes treated with Calp or vehicle (DMF) for 15 min (n = 2). RhoA content was quantified relative to α-actin loading control, and used to correct rhoA activity data. Error bars represent standard deviations. B. Quantification of pRLC and ppRLC in uterine myocytes treated with Calp and with increasing concentrations of a cell-permeable rhoA inhibitor (C3 transferase) by ICW (n = 4). * and ** indicate significant differences from vehicle or Calp alone (second histogram), respectively. Calp (calpeptin); rhoA activator (0.5 mU/mL). p<0.05 in all cases as determined by one-way ANOVA followed by Tukey test.
Figure 3
Figure 3. Quantification of RLC phospho-state distribution.
Panels A-D correspond to WB data derived using an Ab directed toward the C-terminus of RLC. A. Representative WBs demonstrating RLC phospho-states separated by Mn2+-phos-tag SDS-PAGE. Uterine myocytes were lysed and total protein was harvested after the following treatments: untreated, or treated with g-H, Calp, OT, or with their corresponding vehicles. B. Quantification of bands identified in panel A (untreated; n = 12, g-H; n = 5, Calp; n = 8, OT; n = 7). The signals derived from 0pRLCT, 1pRLCT, and 2pRLCT are expressed as the proportion of their sum total within each lane. C. Absolute magnitude of the difference in each phospho-state caused by the treatments in comparison to the corresponding vehicle (‘+’ indicates enhancement relative to vehicle, ‘−’ indicates diminution relative to vehicle). D. Vehicle-corrected distribution data obtained by combining the data in panel C to the untreated group distribution. g-H (glycyl-H-1152); ROK inhibitor (1 µM). Calp (calpeptin); rhoA activator (0.5 mU/mL). OT; oxytocin (100 nM). All data are shown as means ± SEMs. The corresponding numerical data are compiled in Table 1.
Figure 4
Figure 4. Validation of phospho-state data quantification using a loading control.
A. WB for α-actin after traditional and Mn2+-phos-tag SDS-PAGE separation of proteins in lysates from uterine myocytes. In both blots, the anti-α-actin Ab recognizes only a single band. B. Each band in panel B was first normalized for α-actin, then corrected for the vehicle. The data are shown as fold-changes relative to vehicle for g-H (1 µM), Calp (0.5 mU/mL), OT (100 nM). All data are shown as means ± SEMs (n = 4 in all groups).
Figure 5
Figure 5. Demonstration of Phospho-S19-RLC phospho-state distribution in uterine myocytes.
A. Detection of 0pRLC, 1pRLC and 2pRLC separated by Mn2+-phos-tag SDS-PAGE with an Ab toward the C-terminus of RLC (CtRLC) and two Abs (mouse MonoclonalAb [MMAb] and rabbit PolyclonalAb [RPAb]) directed toward phospho-S19-RLC. B. Representative WB demonstrating RLC phospho-states separated by Mn2+-phos-tag SDS-PAGE and probed using PRAb from panel A. Uterine myocytes were lysed and total protein was harvested after the following treatments: untreated, or treated with g-H, Calp, OT, or with their corresponding vehicles. C. Vehicle-corrected distribution data for 1pRLC19 and 2pRLC19 obtained by normalizing the data in panel A to the untreated group distribution. g-H (1 µM, n = 5). Calp (0.5 mU/mL, n = 10). OT (100 nM, n = 10). All data are shown as means ± SEMs. The corresponding numerical data are compiled in Table 2.
Figure 6
Figure 6. PMA induces phosphorylation of RLC at S1 and alters mobility of phospho-RLC during phos-tag SDS-PAGE.
A. WBs produced by Mn2+-phos-tag separation of lysates from uterine myocytes treated with PMA (1 µM) or vehicle. The membranes were probed with an Ab directed against the C- terminus of total-RLC (CtRLC). 0pRLC, 1pRLC, and 2pRLC correspond to non-, mono-, and di-phosphorylated RLC. The bands labeled with ** exhibit unexpected mobility in the Mn2+-phos-tag acrylamide matrix. B. Traditional WBs demonstrating phosphorylation of RLC at S1 (p1RLC) in uterine myocytes treated with PMA. C. Quantification of p1RLC concentrations in uterine myocytes treated with PMA and 4-α-PMA (negative control) by the in-cell western method. In B and C, the data represent 4 independent experiments and are presented as means ± SEM.
Figure 7
Figure 7. Advanced phos-tag analysis of phosphorylated RLC in PMA-treated uterine myocytes.
A and B. WBs produced by Zn2+-phos-tag (40 µM) separation of lysates from untreated samples, or samples treated with PMA (1 µM), CalyculinA (20 nM), or with both. In both A and B, the red signal corresponds to a mouse monoclonal Ab (MMAb) targeting p19RLC that is detected independently of the green signals (CtRLC in panel A, and p1RLC in panel B). A yellow signal indicates overlap of the individual green and red signals. 0pRLC, 1pRLC, 2pRLC and 3pRLC denote non-, mono-, di-, and tri-phosphorylated RLC. The superscripts denote the position of the phospho-modification: 1: S1, 18: T18, 19: S19. The unlabeled arrow below 3pRLC1/18/19 corresponds to 2pRLC18/19 that is particularly prominent in lysates treated with CalyculinA alone.

References

    1. Hunter T. Signaling–2000 and beyond. Cell. 2000;100:113–127. - PubMed
    1. Thingholm TE, Jensen ON, Larsen MR. Analytical strategies for phosphoproteomics. Proteomics. 2009;9:1451–1468. - PubMed
    1. Kinoshita E, Kinoshita-Kikuta E, Takiyama K, Koike T. Phosphate-binding tag, a new tool to visualize phosphorylated proteins. Mol Cell Proteomics. 2006;5:749–757. - PubMed
    1. Kinoshita E, Kinoshita-Kikuta E, Koike T. Separation and detection of large phosphoproteins using Phos-tag SDS-PAGE. Nat Protoc. 2009;4:1513–1521. - PubMed
    1. Takeya K, Loutzenhiser K, Shiraishi M, Loutzenhiser R, Walsh MP. A highly sensitive technique to measure myosin regulatory light chain phosphorylation: the first quantification in renal arterioles. Am J Physiol Renal Physiol. 2008;294:F1487–1492. - PubMed

Publication types

MeSH terms