Pathways of distinction analysis: a new technique for multi-SNP analysis of GWAS data
- PMID: 21695280
- PMCID: PMC3111473
- DOI: 10.1371/journal.pgen.1002101
Pathways of distinction analysis: a new technique for multi-SNP analysis of GWAS data
Abstract
Genome-wide association studies (GWAS) have become increasingly common due to advances in technology and have permitted the identification of differences in single nucleotide polymorphism (SNP) alleles that are associated with diseases. However, while typical GWAS analysis techniques treat markers individually, complex diseases (cancers, diabetes, and Alzheimers, amongst others) are unlikely to have a single causative gene. Thus, there is a pressing need for multi-SNP analysis methods that can reveal system-level differences in cases and controls. Here, we present a novel multi-SNP GWAS analysis method called Pathways of Distinction Analysis (PoDA). The method uses GWAS data and known pathway-gene and gene-SNP associations to identify pathways that permit, ideally, the distinction of cases from controls. The technique is based upon the hypothesis that, if a pathway is related to disease risk, cases will appear more similar to other cases than to controls (or vice versa) for the SNPs associated with that pathway. By systematically applying the method to all pathways of potential interest, we can identify those for which the hypothesis holds true, i.e., pathways containing SNPs for which the samples exhibit greater within-class similarity than across classes. Importantly, PoDA improves on existing single-SNP and SNP-set enrichment analyses, in that it does not require the SNPs in a pathway to exhibit independent main effects. This permits PoDA to reveal pathways in which epistatic interactions drive risk. In this paper, we detail the PoDA method and apply it to two GWAS: one of breast cancer and the other of liver cancer. The results obtained strongly suggest that there exist pathway-wide genomic differences that contribute to disease susceptibility. PoDA thus provides an analytical tool that is complementary to existing techniques and has the power to enrich our understanding of disease genomics at the systems-level.
Conflict of interest statement
The authors have declared that no competing interests exist.
Figures

 distributions (b); a random 12-SNP pathway does not (c). Boxplots are overlayed on the scatterplots of
  for clarity.
 values in CGEMS cases (red) and controls (black) for a SNP-set comprised of four highly-significant SNPs located in the
  gene . As expected, there is a substantial difference in case and control
  values, with the cases having higher
  (i.e., closer to other cases) than controls. The discreteness of the distributions are due to the fact that with four SNPs, a finite number of
  values are possible.
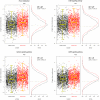
 for each pathway are overlayed with boxplots are given in the left panel; higher values of
  indicate that the sample is closer to other cases than it is to other controls. Distributions of
  for cases (red) and controls (black) are given to the right. A significant shift toward higher
  values is seen in the cases. Odds ratios and FDR-adjusted OR
  values are given.
 for each pathway are overlayed with boxplots are given in the left panel; higher values of
  indicate that the sample is closer to other cases than it is to other controls. Distributions of
  for cases (red) and controls (black) are given to the right. A significant shift toward higher
  values is seen in the cases. Odds ratios and FDR-adjusted OR
  values are given.
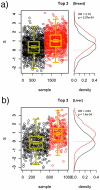
 for the breast cancer data (a) and the liver cancer data (b). Distributions of
  for cases (red) and controls (black) are given to the right. A significant shift toward higher
  values is seen in the cases.
References
-
- Hirschhorn JN, Daly MJ. Genome-wide association studies for common diseases and complex traits. Nat Rev Genet. 2005;6:95–108. - PubMed
-
- McCarthy MI, Abecasis GR, Cardon LR, Goldstein DB, Little J, et al. Genome-wide association studies for complex traits: consensus, uncertainty and challenges. Nat Rev Genet. 2008;9:356–69. - PubMed
-
- Easton DF, Eeles RA. Genome-wide association studies in cancer. Hum Mol Genet. 2008;17:R109–15. - PubMed
Publication types
MeSH terms
Grants and funding
LinkOut - more resources
Full Text Sources
Other Literature Sources

