Comparative Study
. 2012 Aug;34(4):1001-9.
doi: 10.1007/s11357-011-9274-9. Epub 2011 Jun 22.

Exponential growth combined with exponential decline explains lifetime performance evolution in individual and human species

Affiliations
Comparative Study

Exponential growth combined with exponential decline explains lifetime performance evolution in individual and human species

Geoffroy Berthelot et al. Age (Dordr). 2012 Aug.

Abstract

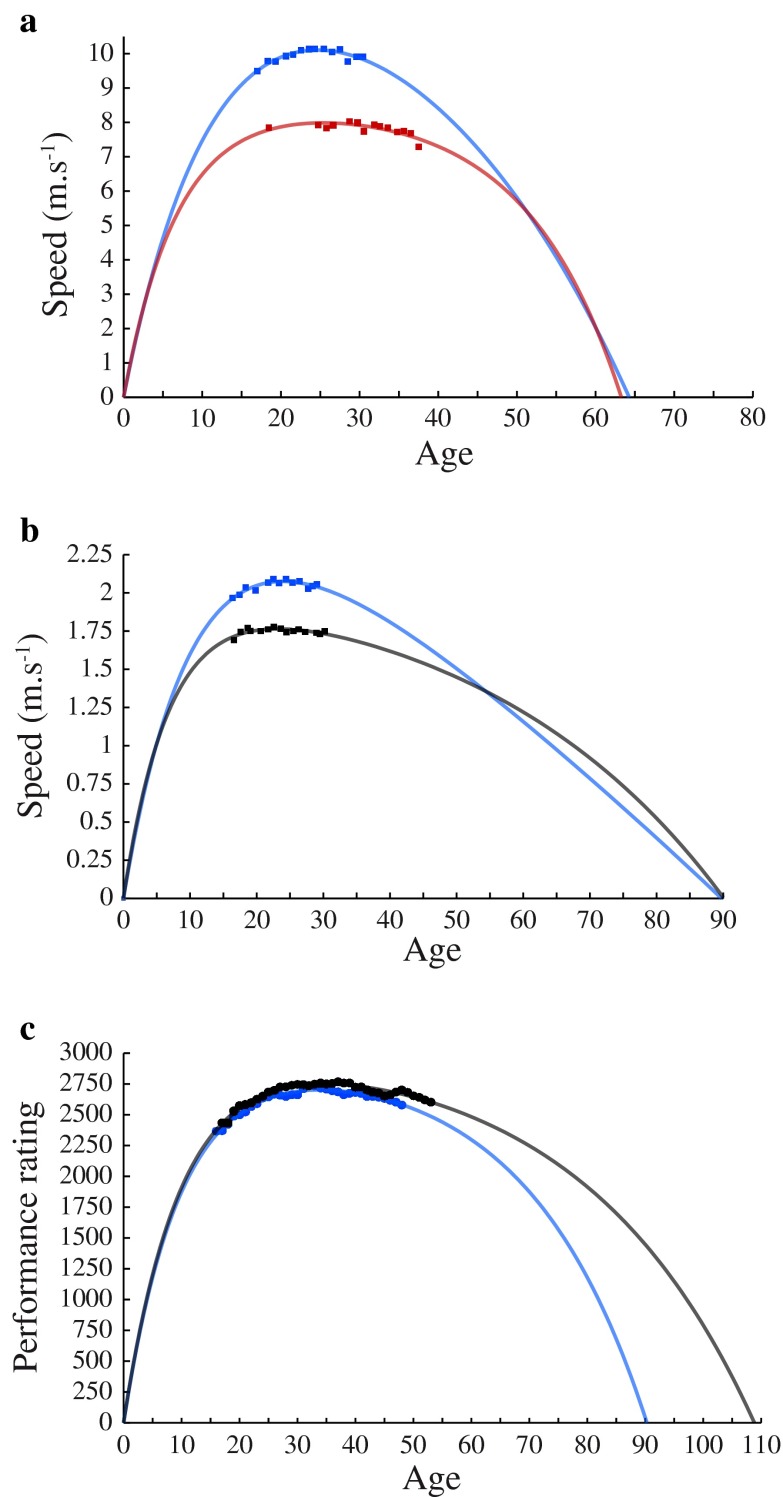
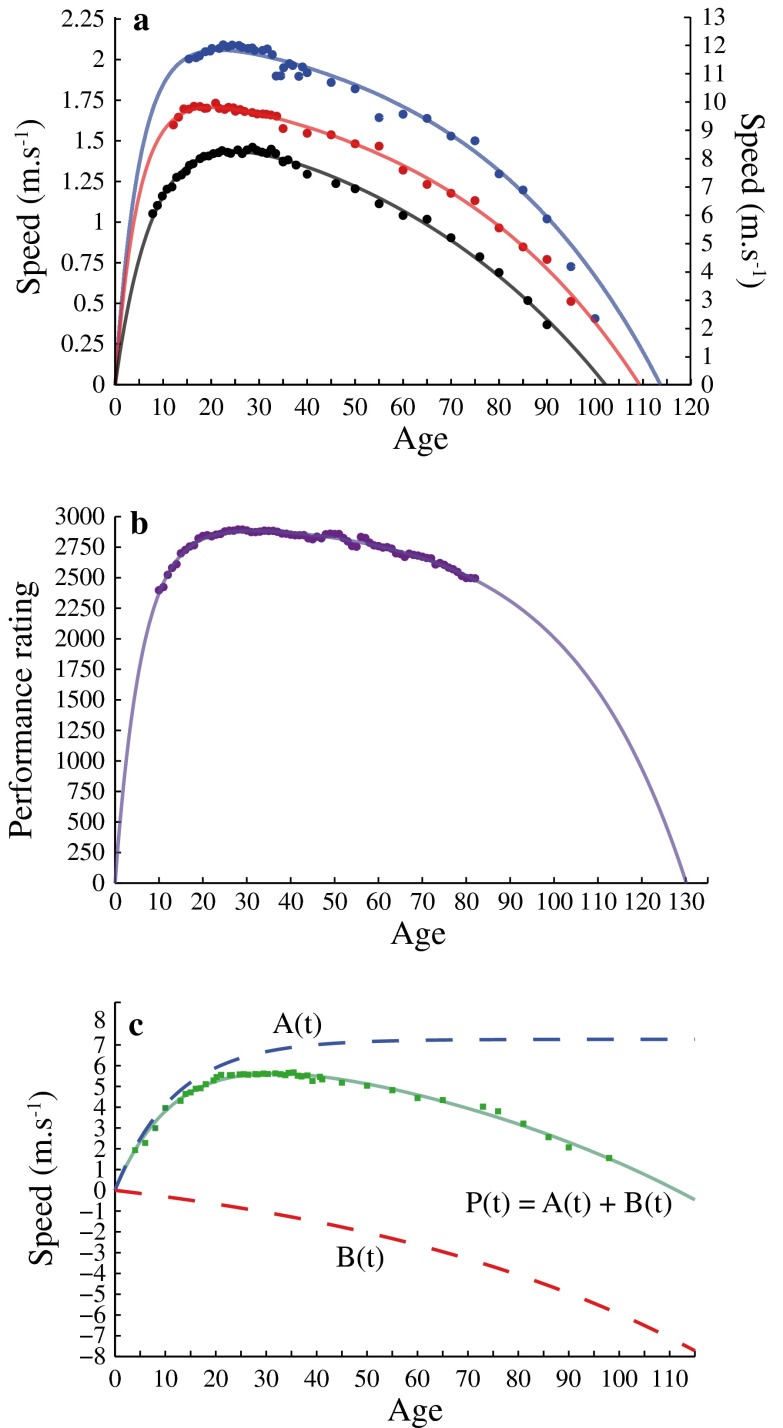
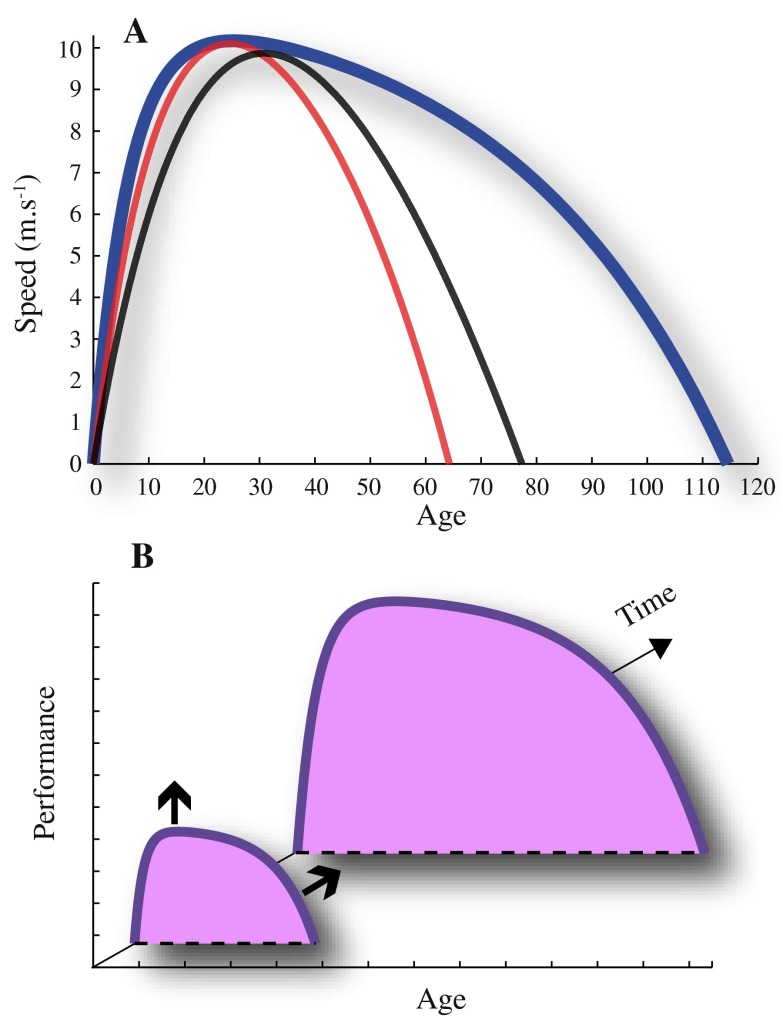
The physiological parameters characterizing human capacities (the ability to move, reproduce or perform tasks) evolve with ageing: performance is limited at birth, increases to a maximum and then decreases back to zero at the day of death. Physical and intellectual skills follow such a pattern. Here, we investigate the development of sport and chess performances during the lifetime at two different scales: the individual athletes' careers and the world record by age class in 25 Olympic sports events and in grandmaster chess players. For all data sets, a biphasic development of growth and decline is described by a simple model that accounts for 91.7% of the variance at the individual level and 98.5% of the variance at the species one. The age of performance peak is computed at 26.1 years old for the events studied (26.0 years old for track and field, 21.0 years old for swimming and 31.4 years old for chess). The two processes (growth and decline) are exponential and start at age zero. Both were previously demonstrated to happen in other human and non-human biological functions that evolve with age. They occur at the individual and species levels with a similar pattern, suggesting a scale invariance property.


Figures

Fig. 1
Fig. 1
The model applied at the individual scale (athletes’ and chess players’ careers). a The model is adjusted to two careers in two track and field events: the 100 m straight (blue men career: Ato Boldon; adjusted R² = 0.99 and peak = 24.63 years old and the 400 m in track & field (red women career: Sandie Richards; R² = 0.99 and peak = 25.37). b The model is adjusted to two careers in swimming: the 100 m freestyle (blue men career: Peter van den Hoogenband; R² = 0.99 and peak = 23.92); the 200 m freestyle (black women career: Martina Morcova; R² = 0.99 and peak = 23.66). c The model is adjusted to two careers in chess: Jonathan Simon Speelman (blue): R² = 0.97 and peak = 33.86 and Jam Timman (black): R² = 0.95 and peak = 34.67
Fig. 2
Fig. 2
The model applied at the species scale. For each age, the maximum performance among the studied careers is gathered. a The model is adjusted to two swimming events (left ordinate): 100 m men (blue, R² = 0.98 and peak = 21.71) and 200 m women (red, R² = 0.99 and peak = 20.04) and to one track and field event (right ordinate): the 400 m women (black R² = 0.99 and peak = 24.72). b The model is adjusted to the best chess performance by age: (purple fit) R 2 = 0.97 and peak = 31.39. c The marathon event (men) is fitted (R² = 0.99 and peak = 31.61). The model used is composed of two antagonists processes: formula image (methods) with A(t) the increasing process formula image and B(t) the declining process formula image
Fig. 3
Fig. 3
Scale invariance and phenotypic expansion. a Estimated curves are plotted for two individual careers (red Ato Boldon, R² = 0.99, peak = 24.63 at 10.10 m s−1 and roots = [0, 64.27] years old; black Johnson Patrick, R² = 0.99, peak = 30.82 at 9.87 m s−1 and estimated roots = [0, 77.38] years old) and the WRa (blue curve) in the 100 m straight in track and field. The model describes how both individual and species scales are related. b Conceptual framework of the phenotypic expansion at work through the XXth century (z-axis). Both performance (y-axis) and life expectancy (x-axis) were limited in the early times of industrial revolution. Both increased during time (black arrows) and allowed for optimizing the human performance and population life expectancy. The shape of the phenotype was thus extended. It now culminates to an optimum but at the price of high primary energy consumption and by stressing the pressure on the biomass

References

    1. Aguilaniu B, Maitre J, Glénet S, Gegout-Petit A, Guénard H. European reference equations for CO and NO lung transfer. Eur Respir J. 2008;31:1091–1097. doi: 10.1183/09031936.00063207. - DOI - PubMed
    1. Alexander RM. Models and the scaling of energy costs for locomotion. J Exp Biol. 2005;208:1645–1652. doi: 10.1242/jeb.01484. - DOI - PubMed
    1. Baker AB, Tang YQ. Aging performance for masters records in athletics, swimming, rowing, cycling triathlon, and weightlifting. Exp Aging Res. 2010;36:453–477. doi: 10.1080/0361073X.2010.507433. - DOI - PubMed
    1. Baker AB, Tang YQ, Turner MJ. Percentage decline in masters superathlete track and field performance with aging. Exp Aging Res. 2003;29:47–65. doi: 10.1080/03610730303706. - DOI - PubMed
    1. Balmer J, Bird S, Davison R. Indoor 16.1-km time-trial performance in 370 cyclists aged 25–63 years. J Sports Sci. 2008;26:57–62. doi: 10.1080/02640410701348651. - DOI - PubMed

Publication types

MeSH terms

LinkOut - more resources