

Diffusion imaging with prospective motion correction and reacquisition
- PMID: 21695721
- PMCID: PMC3121006
- DOI: 10.1002/mrm.22837
Diffusion imaging with prospective motion correction and reacquisition
Abstract
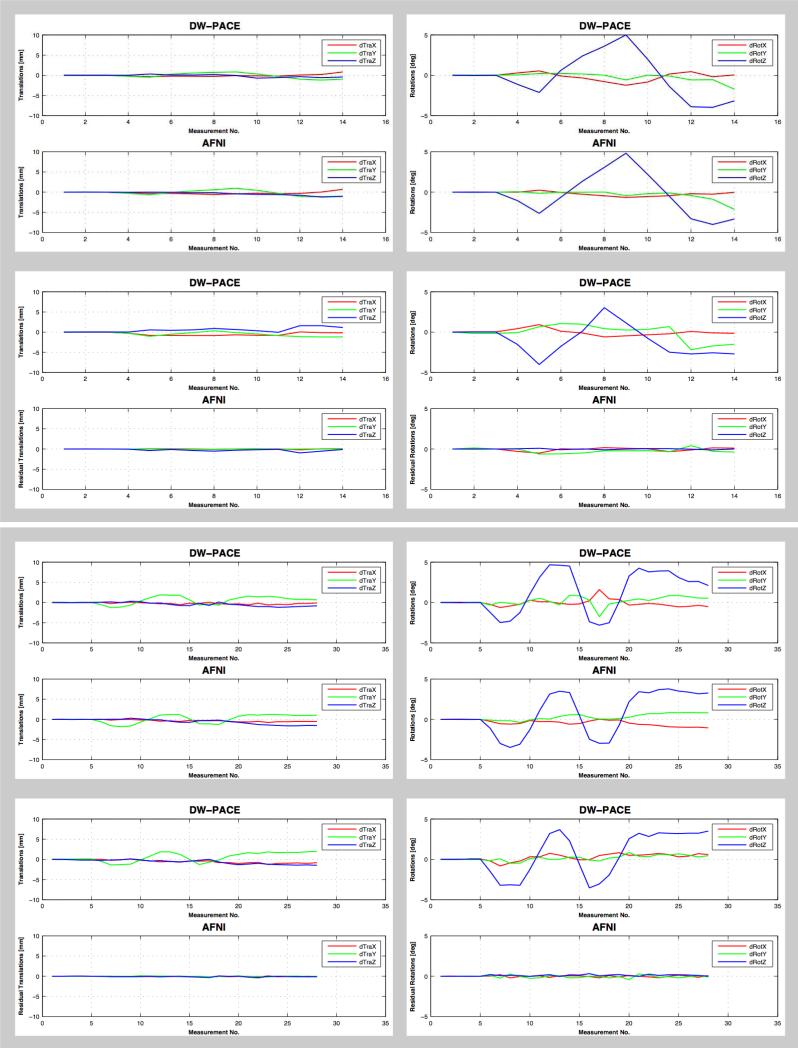
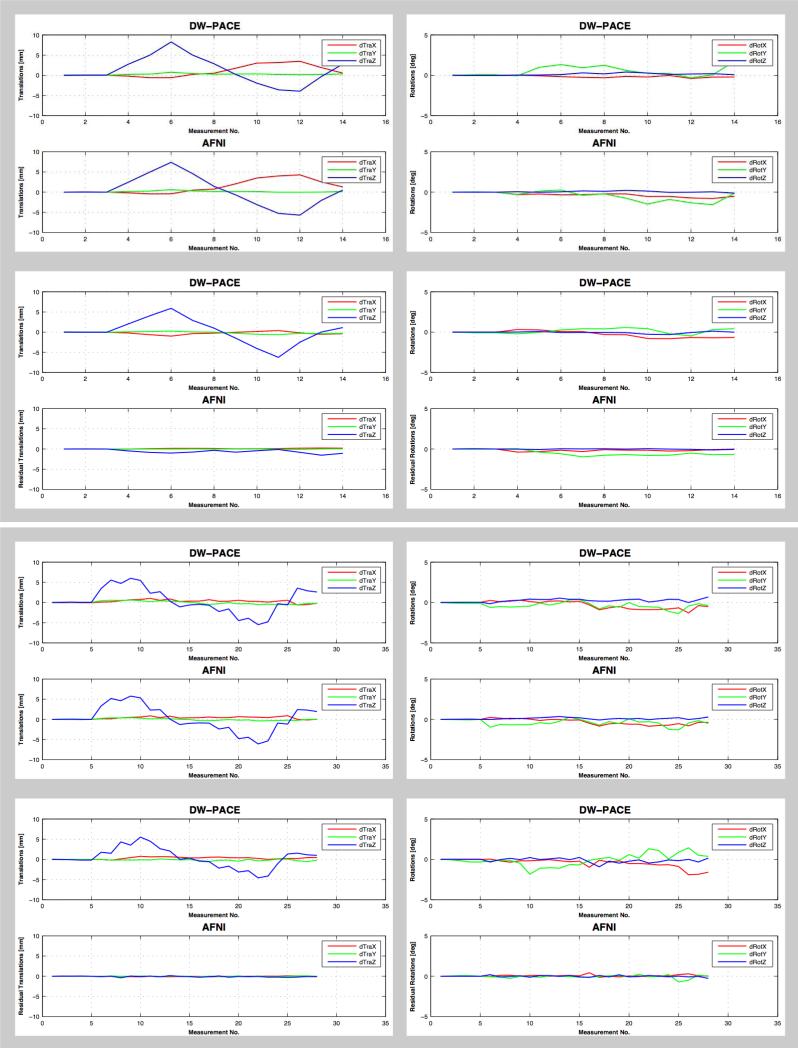
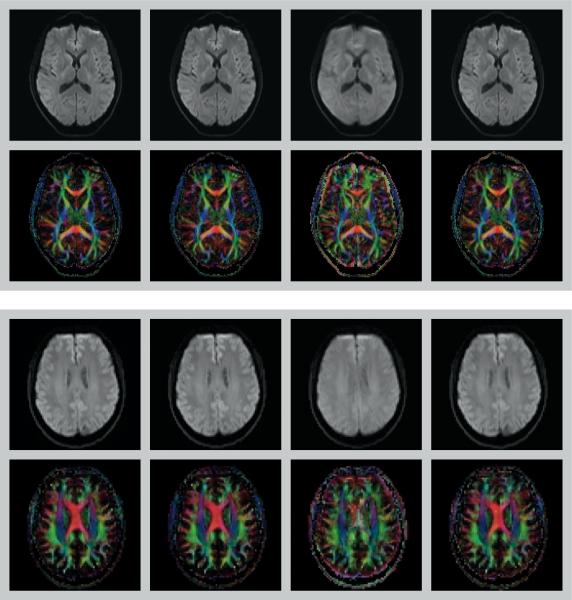
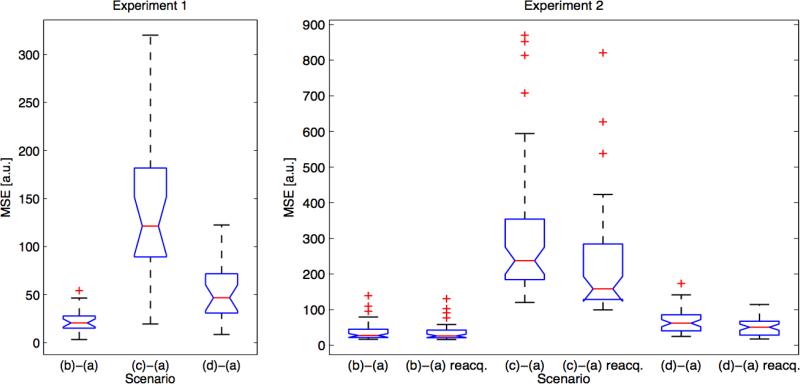
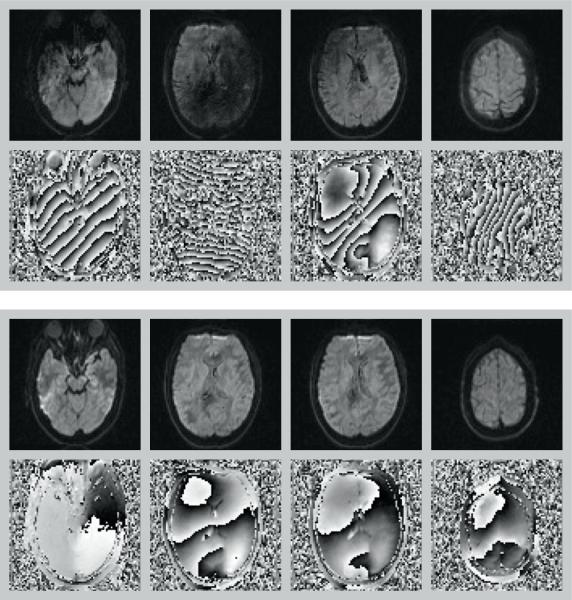
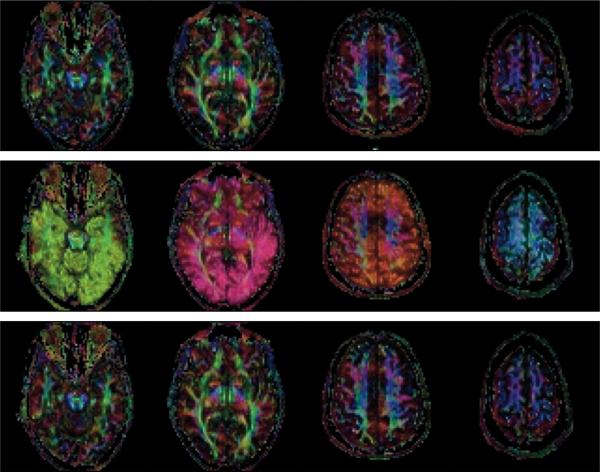
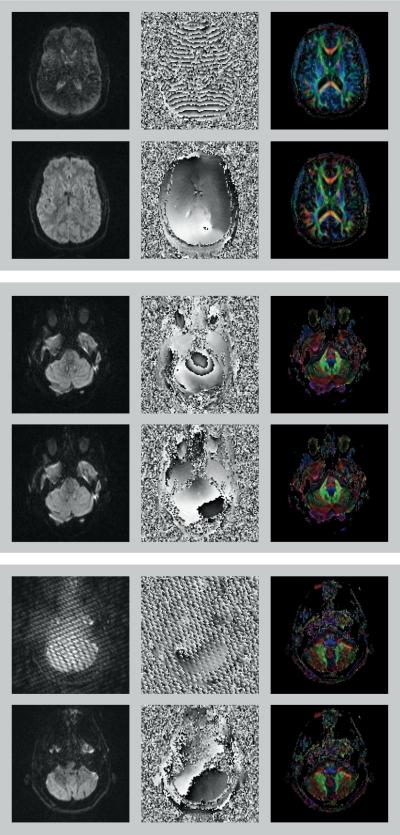
A major source of artifacts in diffusion-weighted imaging is subject motion. Slow bulk subject motion causes misalignment of data when more than one average or diffusion gradient direction is acquired. Fast bulk subject motion can cause signal dropout artifacts in diffusion-weighted images and results in erroneous derived maps, e.g., fractional anisotropy maps. To address both types of artifacts, a fully automatic method is presented that combines prospective motion correction with a reacquisition scheme. Motion correction is based on the prospective acquisition correction method modified to work with diffusion-weighted data. The images to reacquire are determined automatically during the acquisition from the imaging data, i.e., no extra reference scan, navigators, or external devices are necessary. The number of reacquired images, i.e., the additional scan duration can be adjusted freely. Diffusion-weighted prospective acquisition correction corrects slow bulk motion well and reduces misalignment artifacts like image blurring. Mean absolute residual values for translation and rotation were <0.6 mm and 0.5°. Reacquisition of images affected by signal dropout artifacts results in diffusion maps and fiber tracking free of artifacts. The presented method allows the reduction of two types of common motion related artifacts at the cost of slightly increased acquisition time.
Copyright © 2011 Wiley-Liss, Inc.
Figures
Similar articles
-
Prospective motion correction in diffusion-weighted imaging using intermediate pseudo-trace-weighted images.Neuroimage. 2017 Apr 1;149:1-14. doi: 10.1016/j.neuroimage.2016.12.055. Epub 2016 Dec 21. Neuroimage. 2017. PMID: 28011251
-
Volumetric navigators for real-time motion correction in diffusion tensor imaging.Magn Reson Med. 2012 Oct;68(4):1097-108. doi: 10.1002/mrm.23314. Epub 2012 Jan 13. Magn Reson Med. 2012. PMID: 22246720 Free PMC article.
-
High-resolution multi-shot diffusion-weighted MRI combining markerless prospective motion correction and locally low-rank constrained reconstruction.Magn Reson Med. 2023 Feb;89(2):605-619. doi: 10.1002/mrm.29468. Epub 2022 Oct 5. Magn Reson Med. 2023. PMID: 36198013
-
Prospective motion correction with continuous gradient updates in diffusion weighted imaging.Magn Reson Med. 2012 Feb;67(2):326-38. doi: 10.1002/mrm.23230. Epub 2011 Dec 9. Magn Reson Med. 2012. PMID: 22161984
-
Prospective and retrospective motion correction in diffusion magnetic resonance imaging of the human brain.Neuroimage. 2012 Jan 2;59(1):389-98. doi: 10.1016/j.neuroimage.2011.07.004. Epub 2011 Jul 13. Neuroimage. 2012. PMID: 21763773
Cited by
-
Differences in the right inferior longitudinal fasciculus but no general disruption of white matter tracts in children with autism spectrum disorder.Proc Natl Acad Sci U S A. 2014 Feb 4;111(5):1981-6. doi: 10.1073/pnas.1324037111. Epub 2014 Jan 21. Proc Natl Acad Sci U S A. 2014. PMID: 24449864 Free PMC article.
-
Developmental Changes in the Integration of Affective and Cognitive Corticostriatal Pathways are Associated with Reward-Driven Behavior.Cereb Cortex. 2018 Aug 1;28(8):2834-2845. doi: 10.1093/cercor/bhx162. Cereb Cortex. 2018. PMID: 29106535 Free PMC article.
-
Imaging Neurochemistry and Brain Structure Tracks Clinical Decline and Mechanisms of ALS in Patients.Front Neurol. 2020 Dec 3;11:590573. doi: 10.3389/fneur.2020.590573. eCollection 2020. Front Neurol. 2020. PMID: 33343494 Free PMC article.
-
Facilitating diffusion tensor imaging of the brain during continuous gross head motion with first and second order motion compensating diffusion gradients.Magn Reson Med. 2024 Apr;91(4):1556-1566. doi: 10.1002/mrm.29924. Epub 2023 Dec 10. Magn Reson Med. 2024. PMID: 38073070 Free PMC article.
-
Prevention of motion-induced signal loss in diffusion-weighted echo-planar imaging by dynamic restoration of gradient moments.Magn Reson Med. 2014 Jun;71(6):2006-13. doi: 10.1002/mrm.24857. Epub 2013 Jul 2. Magn Reson Med. 2014. PMID: 23821373 Free PMC article.
References
-
- Stejskal EO, Tanner JE. Spin Diffusion Measurements: Spin Echoes in the Presence of a Time□Dependent Field Gradient. J. Chem. Phys. 1965;42(1):288–92.
-
- Schaefer PW, Grant PE, Gonzalez RG. Diffusion-weighted MR imaging of the brain. Radiology. 2000 Nov;217(2):331–45. - PubMed
-
- Johansen-Berg H, Rushworth MF. Using diffusion imaging to study human connectional anatomy. Annu Rev Neurosci. 2009;32:75–94. - PubMed
-
- Pipe JG, Farthing VG, Forbes KP. Multishot diffusion-weighted FSE using PROPELLER MRI. Magn Reson Med. 2002 Jan;47(1):42–52. - PubMed
-
- Liu C, Bammer R, Kim DH, Moseley ME. Self-navigated interleaved spiral (SNAILS): application to high-resolution diffusion tensor imaging. Magn Reson Med. 2004 Dec;52(6):1388–96. - PubMed
Publication types
MeSH terms
Grants and funding
- S10RR023043/RR/NCRR NIH HHS/United States
- S10 RR019254/RR/NCRR NIH HHS/United States
- S10 RR019307/RR/NCRR NIH HHS/United States
- 5R01CA137254-02/CA/NCI NIH HHS/United States
- S10RR021110/RR/NCRR NIH HHS/United States
- S10RR019307/RR/NCRR NIH HHS/United States
- S10 RR023043/RR/NCRR NIH HHS/United States
- S10RR019254/RR/NCRR NIH HHS/United States
- P41RR14075/RR/NCRR NIH HHS/United States
- S10 RR023401/RR/NCRR NIH HHS/United States
- R01 CA137254/CA/NCI NIH HHS/United States
- S10 RR021110/RR/NCRR NIH HHS/United States
- S10RR023401/RR/NCRR NIH HHS/United States
- P41 RR014075/RR/NCRR NIH HHS/United States
LinkOut - more resources
Full Text Sources
Other Literature Sources
