

Comparison of lung T2* during free-breathing at 1.5 T and 3.0 T with ultrashort echo time imaging
- PMID: 21695727
- PMCID: PMC3122137
- DOI: 10.1002/mrm.22829
Comparison of lung T2* during free-breathing at 1.5 T and 3.0 T with ultrashort echo time imaging
Abstract
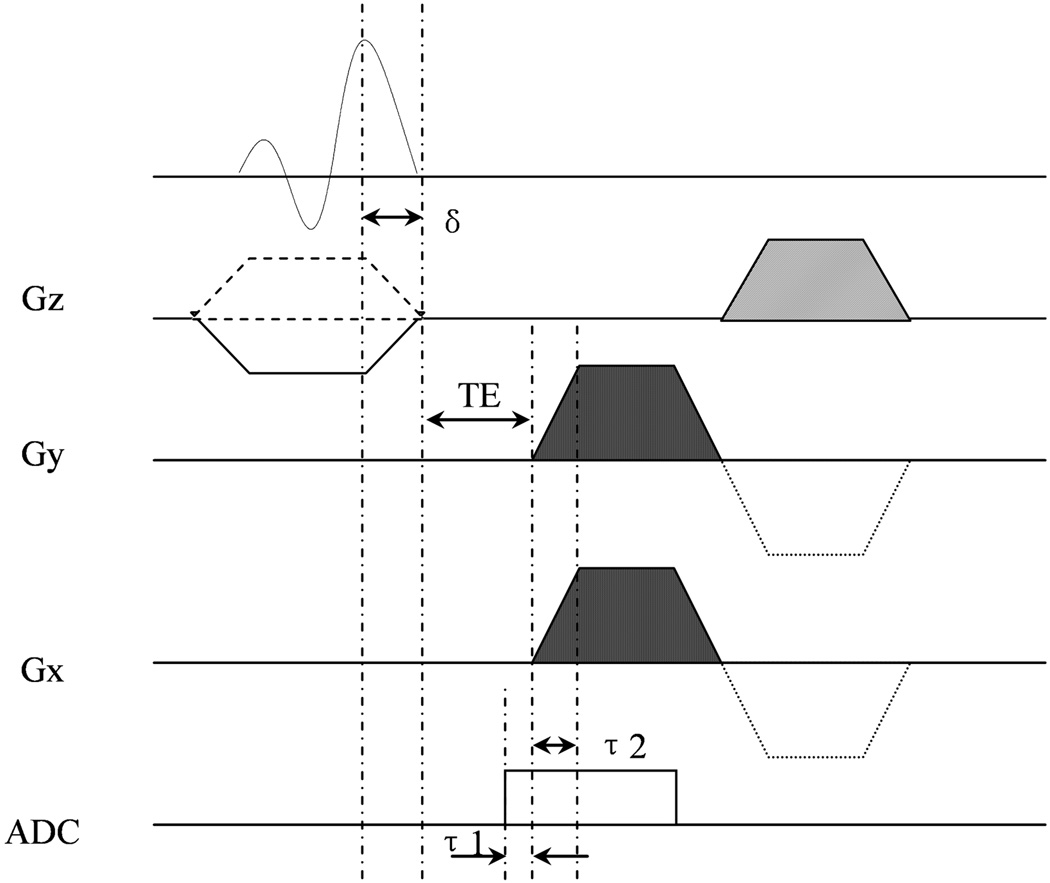
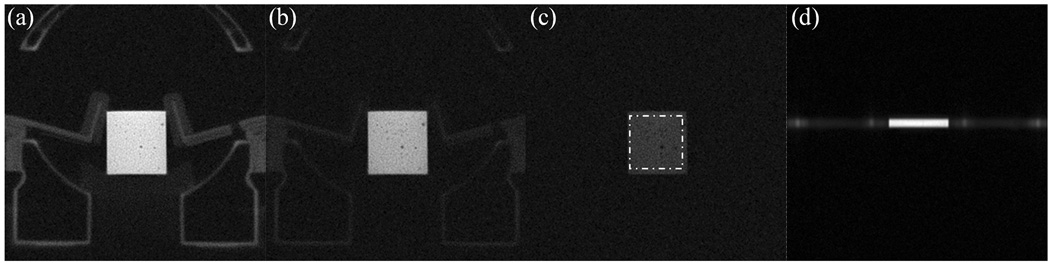
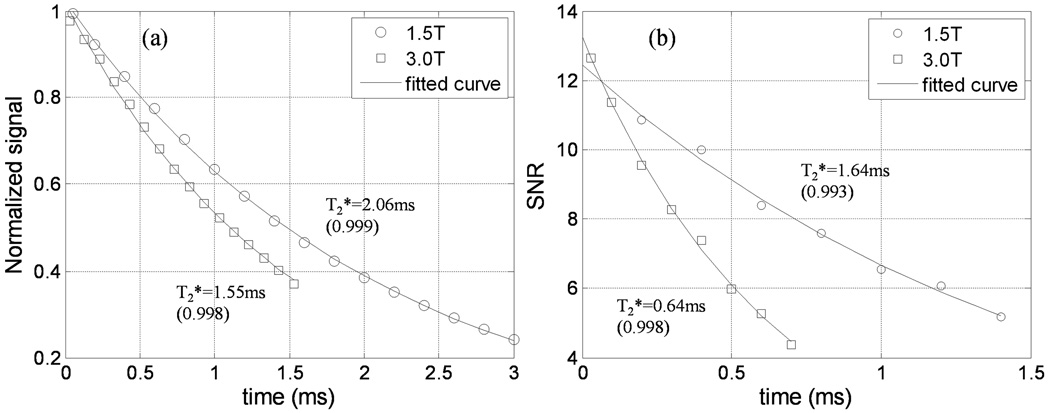
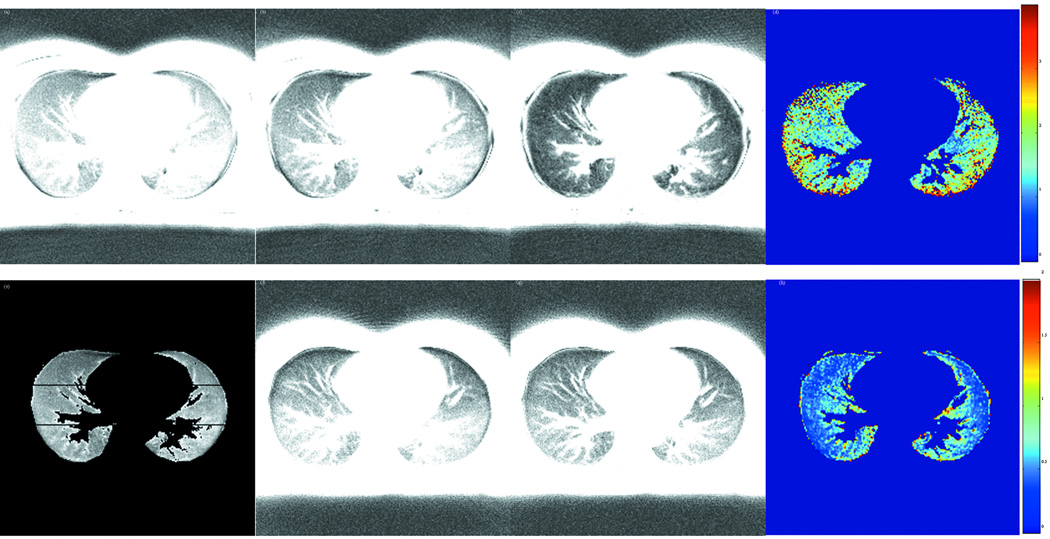
Assessment of lung effective transverse relaxation time (T(2)*) may play an important role in the detection of structural and functional changes caused by lung diseases such as emphysema and chronic bronchitis. While T(2)* measurements have been conducted in both animals and humans at 1.5 T, studies on human lung at 3.0 T have not yet been reported. In this work, ultrashort echo time imaging technique was applied for the measurement and comparison of T(2)* values in normal human lungs at 1.5 T and 3.0 T. A 2D ultrashort echo time pulse sequence was implemented and evaluated in phantom experiments, in which an eraser served as a homogeneous short T(2)* sample. For the in vivo study, five normal human subjects were imaged at both field strengths and the results compared. The average T(2)* values measured during free-breathing were 2.11(±0.27) ms at 1.5 T and 0.74(±0.1) ms at 3.0 T, respectively, resulting in a 3.0 T/1.5 T ratio of 2.9. Furthermore, comparison of the relaxation values at end-expiration and end-inspiration, accomplished through self-gating, showed that during normal breathing, differences in T(2)* between the two phases may be negligible.
Copyright © 2011 Wiley-Liss, Inc.
Figures
References
-
- Gewalt SL, Glover GH, Hedlund LW, Cofer GP, MacFall JR, Johnson GA. MR microscopy of the rat lung using projection reconstruction. Magn Reson Med. 1993;29(1):99–106. - PubMed
-
- Bergin CJ, Pauly JM, Macovski A. Lung parenchyma: projection reconstruction MR imaging. Radiology. 1991;179(3):777–781. - PubMed
-
- Pauly JCSND. Slice selective excitation for very short T2 species. Presented at the Ninth Annual Scientific Meeting and Exhibition of the Society of Magnetic Resonance in Medicine; August:18–27; New York: 1990.
-
- Robson MD, Gatehouse PD, Bydder M, Bydder GM. Magnetic resonance: an introduction to ultrashort TE (UTE) imaging. Journal of computer assisted tomography. 2003;27(6):825–846. - PubMed
-
- Aranee Techawiboonwong HKSaFWW. In vivo MRI of submillisecond T2 species with two-dimensional and three-dimensional radial sequences and applications to the measurement of cortical bone water. NMR Biomed. 2008;21:59–70. - PubMed
Publication types
MeSH terms
Grants and funding
LinkOut - more resources
Full Text Sources
Other Literature Sources
Medical
