. 2011 Jun 22:12:254.
doi: 10.1186/1471-2105-12-254.

Fusion of metabolomics and proteomics data for biomarkers discovery: case study on the experimental autoimmune encephalomyelitis

Affiliations

Fusion of metabolomics and proteomics data for biomarkers discovery: case study on the experimental autoimmune encephalomyelitis

Lionel Blanchet et al. BMC Bioinformatics. .

Abstract

Background: Analysis of Cerebrospinal Fluid (CSF) samples holds great promise to diagnose neurological pathologies and gain insight into the molecular background of these pathologies. Proteomics and metabolomics methods provide invaluable information on the biomolecular content of CSF and thereby on the possible status of the central nervous system, including neurological pathologies. The combined information provides a more complete description of CSF content. Extracting the full combined information requires a combined analysis of different datasets i.e. fusion of the data.

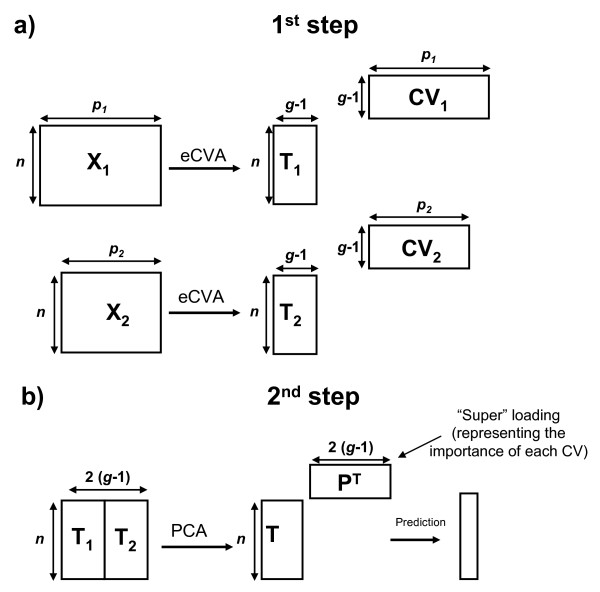
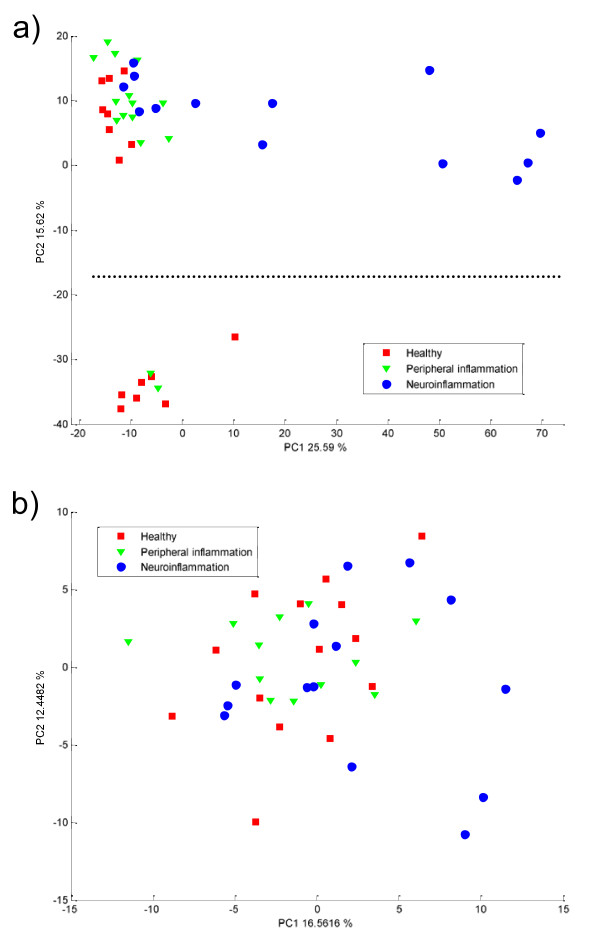
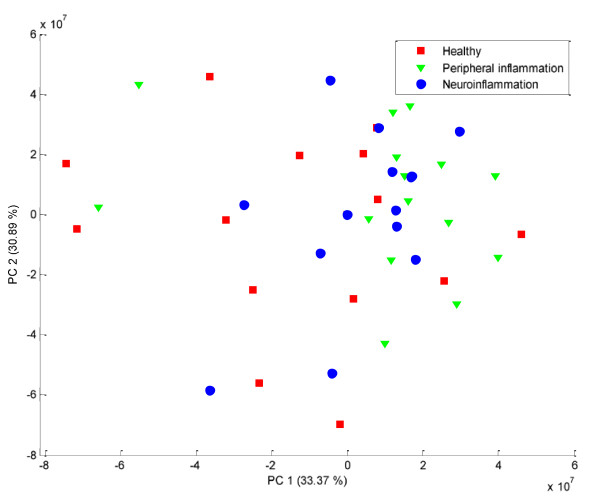
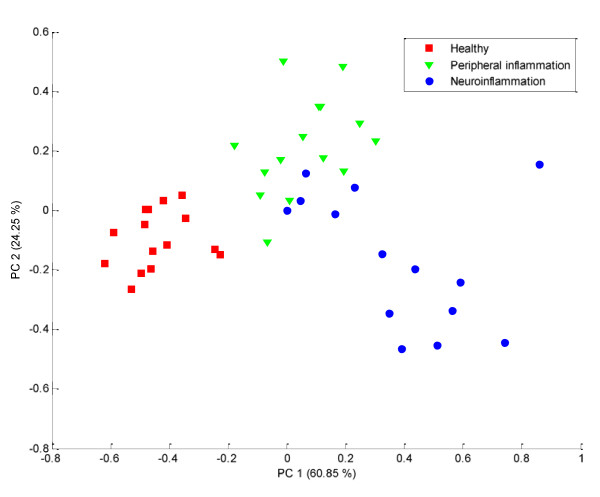
Results: A novel fusion method is presented and applied to proteomics and metabolomics data from a pre-clinical model of multiple sclerosis: an Experimental Autoimmune Encephalomyelitis (EAE) model in rats. The method follows a mid-level fusion architecture. The relevant information is extracted per platform using extended canonical variates analysis. The results are subsequently merged in order to be analyzed jointly. We find that the combined proteome and metabolome data allow for the efficient and reliable discrimination between healthy, peripherally inflamed rats, and rats at the onset of the EAE. The predicted accuracy reaches 89% on a test set. The important variables (metabolites and proteins) in this model are known to be linked to EAE and/or multiple sclerosis.

Conclusions: Fusion of proteomics and metabolomics data is possible. The main issues of high-dimensionality and missing values are overcome. The outcome leads to higher accuracy in prediction and more exhaustive description of the disease profile. The biological interpretation of the involved variables validates our fusion approach.


Figures

Figure 1
Figure 1
Architecture of the mid-level fusion analysis employed here on two data sets X1and X2. The same n samples are divided in g groups. a) eCVA is applied on each data set to determine the Canonical Variates CV1and CV2allowing the best discrimination and the corresponding scores T1and T2. b) The scores are merged and analyzed using PCA. The global scores T and super loadings PTare obtained. Class prediction is obtained based on T.
Figure 2
Figure 2
PCA score plot obtained on a) proteomics data and b) metabolomics data after autoscaling. The healthy and inflammation controls are represented as red squares and green triangles. The disease samples are in blue circles. The dotted line in a) represent the separation between the two batches of measurements.
Figure 3
Figure 3
Score plot obtained on the concatenation of the proteomics and metabolomics data sets after autoscaling and PCA. The healthy and inflammation controls are represented in red and green. The disease samples are in blue. The three classes overlap completely.
Figure 4
Figure 4
PCA score plot allowing the visualization of the results of the fusion of proteomics and metabolomics platforms. The samples are color-coded according to group labels: in red squares the healthy control, in green triangles the inflammation group and in blue circles the disease group.
Figure 5
Figure 5
Correlation network centered on hemopexin (P20059) and T-kininogen 1 (P01048). The two first layers of correlation are represented. The correlations observed in the healthy control samples are represented by solid black line, the ones in the disease group by dotted lines.

Similar articles

Cited by

References

    1. Silberring J, Ciborowski P. Biomarkers discovery and clinical proteomics. TrAC Trend anal Chem. 2010;29(2):128–140. doi: 10.1016/j.trac.2009.11.007. - DOI - PMC - PubMed
    1. Chambers G, Lawrie L, Cash P, Murray GI. Proteomics: a new approach to the study of disease. J Pathol. 2000;192(3):280–288. doi: 10.1002/1096-9896(200011)192:3<280::AID-PATH748>3.0.CO;2-L. - DOI - PubMed
    1. Gowda GAN, Zhang S, Gu H, Asiago V, Shanaiah N, Raftery D. Metabolomics-based methods for early disease diagnostics. Expert Rev Mol Diagn. 2008;8(5):617–633. doi: 10.1586/14737159.8.5.617. - DOI - PMC - PubMed
    1. van der Greef J, Stroobant P, van der Heijden R. The role of analytical sciences in medical systems biology. Curr Opin Chem Biol. 2004;8(5):559–565. doi: 10.1016/j.cbpa.2004.08.013. - DOI - PubMed
    1. Ibrahim SM, Gold R. Genomics, proteomics, metabolomics: what is in a word for multiple sclerosis? Curr Opin Neurol. 2005;18(3):231–235. doi: 10.1097/01.wco.0000169738.06664.3b. - DOI - PubMed

Publication types

MeSH terms

LinkOut - more resources