

Stromal upregulation of lateral epithelial adhesions: gene expression analysis of signalling pathways in prostate epithelium
- PMID: 21696611
- PMCID: PMC3141633
- DOI: 10.1186/1423-0127-18-45
Stromal upregulation of lateral epithelial adhesions: gene expression analysis of signalling pathways in prostate epithelium
Abstract
Background: Stromal signalling increases the lateral cell adhesions of prostate epithelial cells grown in 3D culture. The aim of this study was to use microarray analysis to identify significant epithelial signalling pathways and genes in this process.
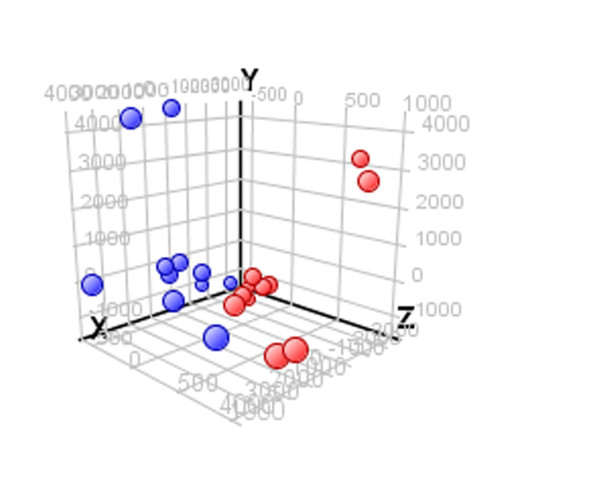
Methods: Microarray analysis was used to identify genes that were differentially expressed when epithelial cells were grown in 3D Matrigel culture with stromal co-culture compared to without stroma. Two culture models were employed: primary epithelial cells (ten samples) and an epithelial cell line (three experiments). A separate microarray analysis was performed on each model system and then compared to identify tissue-relevant genes in a cell line model.
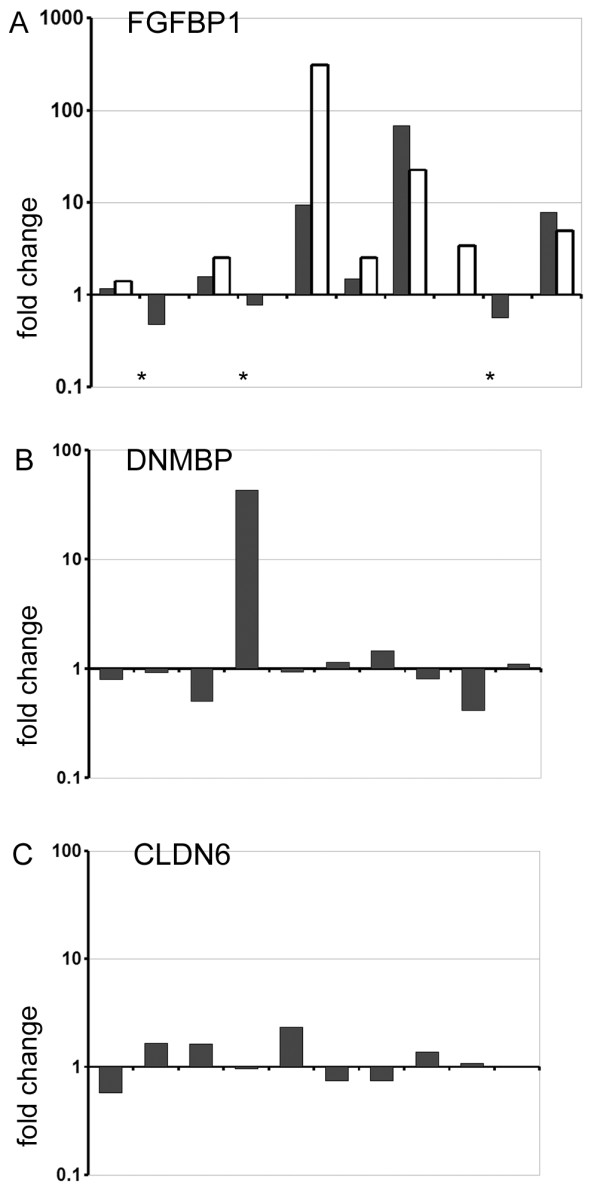
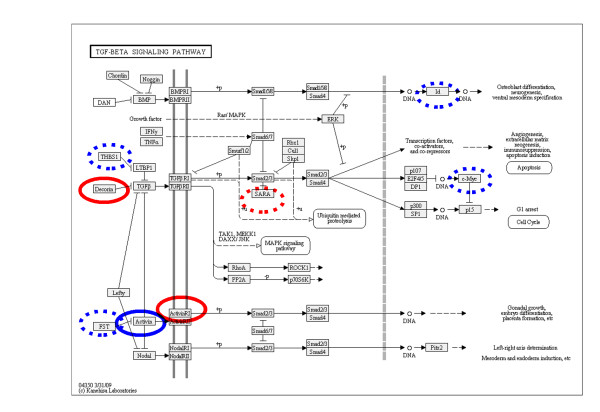
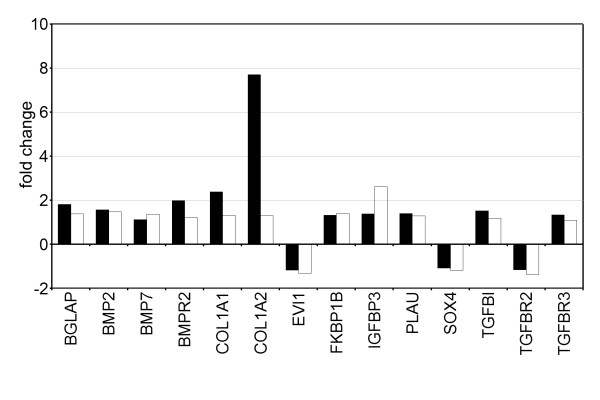
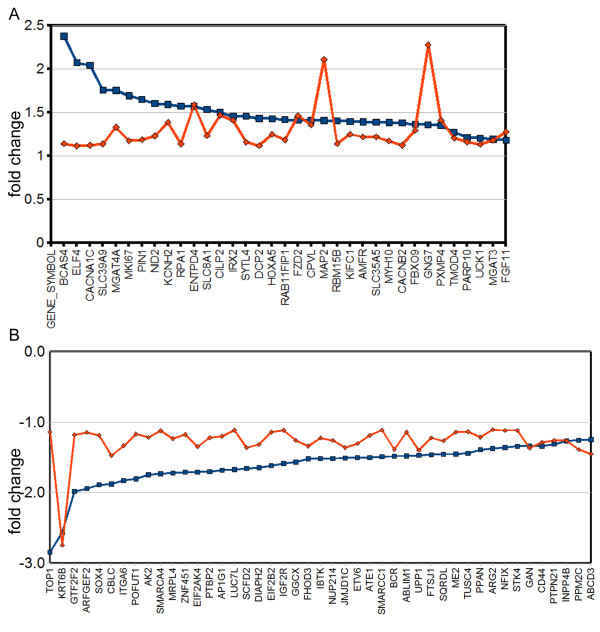
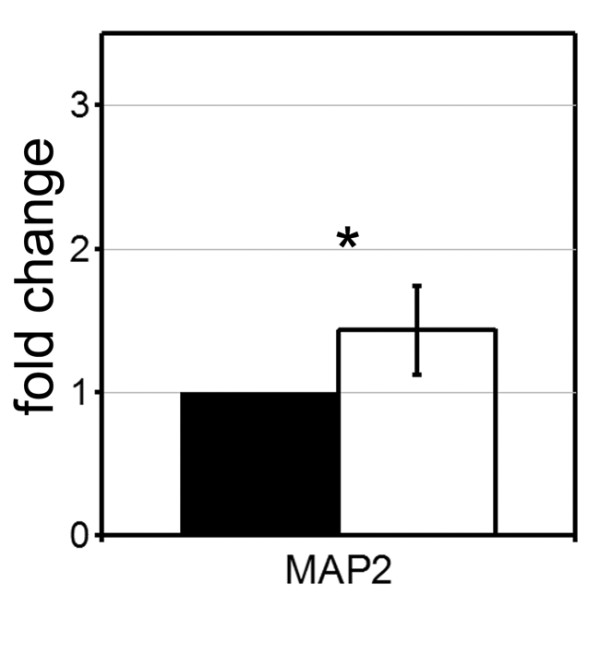
Results: TGF beta signalling was significantly ranked for both model systems and in both models the TGF beta signalling gene SOX4 was significantly down regulated. Analysis of all differentially expressed genes to identify genes that were common to both models found several morphology related gene clusters; actin binding (DIAPH2, FHOD3, ABLIM1, TMOD4, MYH10), GTPase activator activity (BCR, MYH10), cytoskeleton (MAP2, MYH10, TMOD4, FHOD3), protein binding (ITGA6, CD44), proteinaceous extracellular matrix (NID2, CILP2), ion channel/ ion transporter activity (CACNA1C, CACNB2, KCNH2, SLC8A1, SLC39A9) and genes associated with developmental pathways (POFUT1, FZD2, HOXA5, IRX2, FGF11, SOX4, SMARCC1).
Conclusions: In 3D prostate cultures, stromal cells increase lateral epithelial cell adhesions. We show that this morphological effect is associated with gene expression changes to TGF beta signalling, cytoskeleton and anion activity.
Figures
Similar articles
-
Stroma regulates increased epithelial lateral cell adhesion in 3D culture: a role for actin/cadherin dynamics.PLoS One. 2011 Apr 18;6(4):e18796. doi: 10.1371/journal.pone.0018796. PLoS One. 2011. PMID: 21533155 Free PMC article.
-
Developmental and hormonal regulation of transforming growth factor-beta1 (TGFbeta1), -2, and -3 gene expression in isolated prostatic epithelial and stromal cells: epidermal growth factor and TGFbeta interactions.Endocrinology. 1998 Mar;139(3):1378-88. doi: 10.1210/endo.139.3.5787. Endocrinology. 1998. PMID: 9492075
-
Prostatic ductal system in rats: tissue-specific expression and regional variation in stromal distribution of transforming growth factor-beta 1.Prostate. 1997 Sep 15;33(1):64-71. doi: 10.1002/(sici)1097-0045(19970915)33:1<64::aid-pros11>3.0.co;2-j. Prostate. 1997. PMID: 9294629
-
Role of the adjacent stroma cells in prostate cancer development and progression: synergy between TGF-β and IGF signaling.Biomed Res Int. 2014;2014:502093. doi: 10.1155/2014/502093. Epub 2014 Jun 25. Biomed Res Int. 2014. PMID: 25089270 Free PMC article. Review.
-
Mesenchymal-epithelial interactions and transforming growth factor-beta 1 expression during normal and abnormal prostatic growth.Microsc Res Tech. 1995 Mar 1;30(4):333-41. doi: 10.1002/jemt.1070300408. Microsc Res Tech. 1995. PMID: 7541677 Review.
Cited by
-
Meta-Analysis of Public Microarray Datasets Reveals Voltage-Gated Calcium Gene Signatures in Clinical Cancer Patients.PLoS One. 2015 Jul 6;10(7):e0125766. doi: 10.1371/journal.pone.0125766. eCollection 2015. PLoS One. 2015. PMID: 26147197 Free PMC article.
-
Genetic Determinants of Metabolism and Benign Prostate Enlargement: Associations with Prostate Volume.PLoS One. 2015 Jul 9;10(7):e0132028. doi: 10.1371/journal.pone.0132028. eCollection 2015. PLoS One. 2015. PMID: 26158673 Free PMC article.
-
Sodium-calcium exchanger 1 regulates epithelial cell migration via calcium-dependent extracellular signal-regulated kinase signaling.J Biol Chem. 2015 May 15;290(20):12463-73. doi: 10.1074/jbc.M114.629519. Epub 2015 Mar 13. J Biol Chem. 2015. PMID: 25770213 Free PMC article.
-
Altered DNA methylation indicates an oscillatory flow mediated epithelial-to-mesenchymal transition signature in ascending aorta of patients with bicuspid aortic valve.Sci Rep. 2018 Feb 9;8(1):2777. doi: 10.1038/s41598-018-20642-4. Sci Rep. 2018. PMID: 29426841 Free PMC article.
-
3D Cultures of prostate cancer cells cultured in a novel high-throughput culture platform are more resistant to chemotherapeutics compared to cells cultured in monolayer.PLoS One. 2014 Nov 7;9(11):e111029. doi: 10.1371/journal.pone.0111029. eCollection 2014. PLoS One. 2014. PMID: 25380249 Free PMC article.
References
-
- Lecuit T, Lenne PF. Cell surface mechanics and the control of cell shape, tissue patterns and morphogenesis. Nature Rev Mol Cell Biol. 2007;8:633–644. - PubMed
-
- Halbleib JM, Nelson WJ. Cadherins in development: cell adhesion, sorting, and tissue morphogenesis. Genes & Development. 2008;20:3199–3214. - PubMed
Publication types
MeSH terms
Substances
Grants and funding
LinkOut - more resources
Full Text Sources
Miscellaneous
