

Both the variability and level of mouse allergen exposure influence the phenotype of the immune response in workers at a mouse facility
- PMID: 21696812
- PMCID: PMC3149759
- DOI: 10.1016/j.jaci.2011.04.050
Both the variability and level of mouse allergen exposure influence the phenotype of the immune response in workers at a mouse facility
Abstract
Background: The role of natural aeroallergen exposure in modulating allergen-specific immune responses is not well understood.
Objective: We sought to examine relationships between mouse allergen exposure and mouse-specific immune responses.
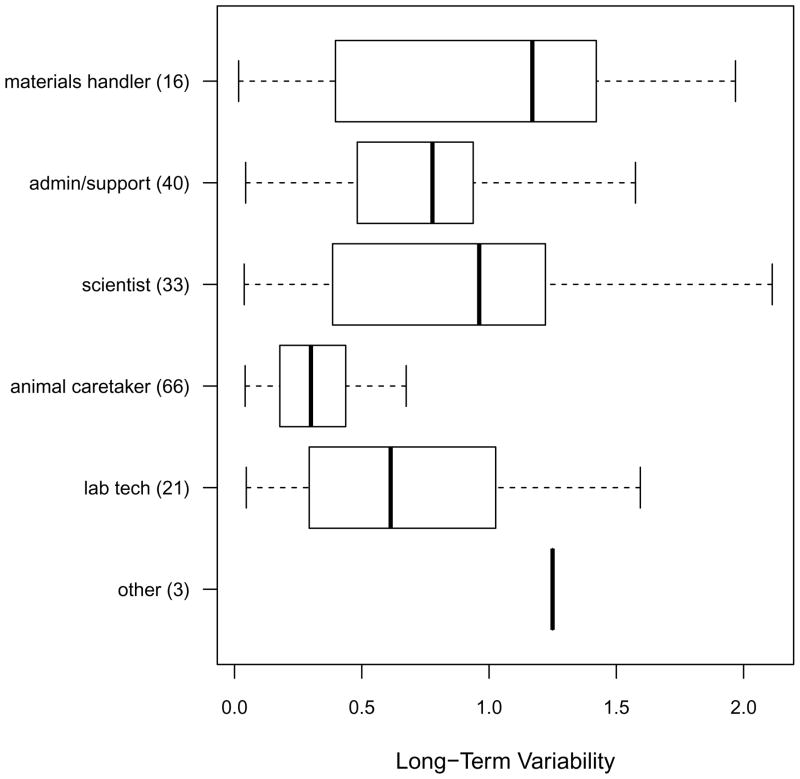
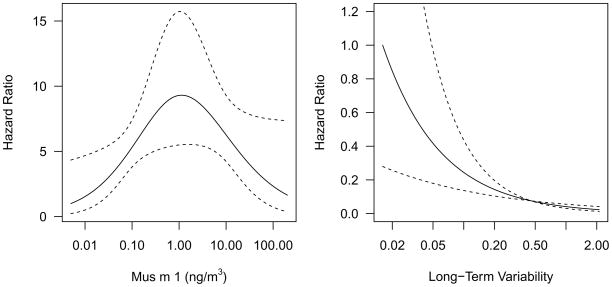
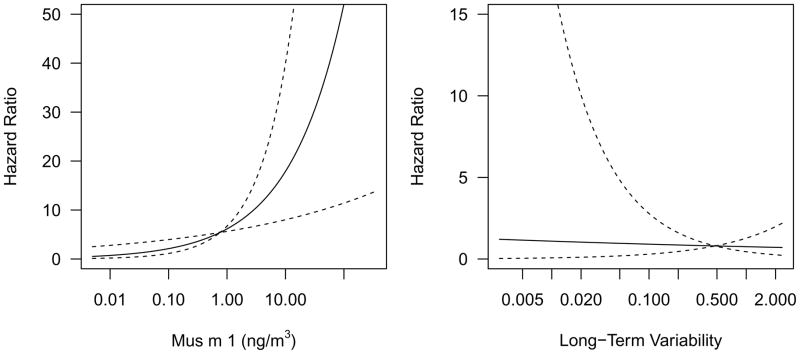
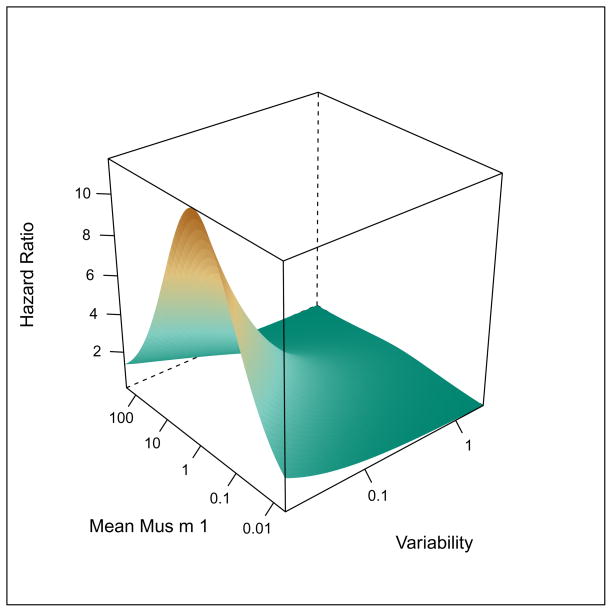
Methods: New employees (n = 179) at a mouse facility underwent repeated assessment of mouse allergen exposure, skin prick tests (SPTs), and measurement of mouse-specific IgG levels. Relationships between the mean level of exposure, variability of exposure (calculated as log deviation), and time to development of immunologic outcomes were examined by using Cox proportional hazards models.
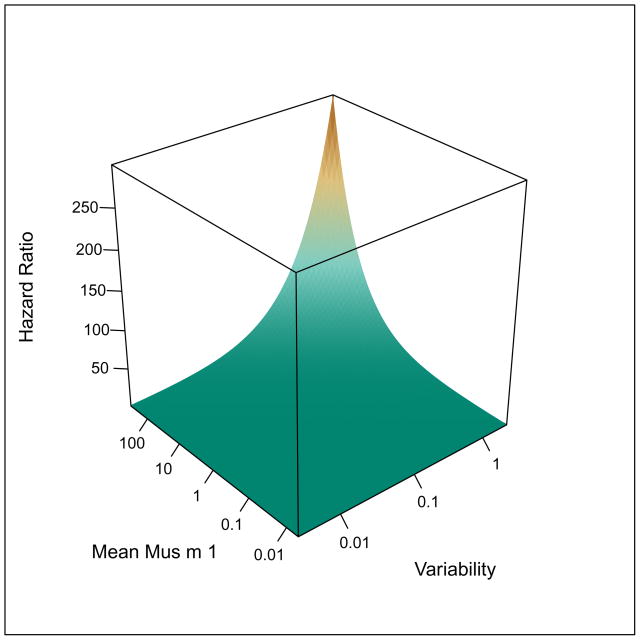
Results: By 24 months, 32 (23%) participants had experienced a positive SPT response, and 10 (8%) had mouse-specific IgG₄. The incidence of a positive SPT response increased as levels of exposure increased from low to moderate, peaking at 1.2 ng/m³, and decreased beyond this point (P = .04). The more variable the exposure was across visits, the lower the incidence of a positive SPT response (hazard ratio [HR], 0.17; 95% CI, 0.07-0.41). Variability of exposure was an independent predictor of a positive SPT response in a model that included both exposure metrics. In contrast, the incidence of mouse-specific IgG₄ increased with increasing levels of mouse allergen exposure (HR, 2.9; 95% CI, 1.4-6.0), and there was evidence of a higher risk of mouse-specific IgG₄ with greater variability of exposure (HR, 6.3; 95% CI, 0.4-95.2).
Conclusion: Both the level and variability of mouse allergen exposure influence the humoral immune response, with specific patterns of exposure associated with specific immunophenotypes. Exposure variability might be a more important predictor of a positive SPT response, whereas the average exposure level might be a more important predictor of mouse-specific IgG₄.
Copyright © 2011 American Academy of Allergy, Asthma & Immunology. Published by Mosby, Inc. All rights reserved.
Figures
Similar articles
-
Mouse allergen exposure and immunologic responses: IgE-mediated mouse sensitization and mouse specific IgG and IgG4 levels.Ann Allergy Asthma Immunol. 2004 Aug;93(2):171-8. doi: 10.1016/S1081-1206(10)61471-8. Ann Allergy Asthma Immunol. 2004. PMID: 15328678
-
A comparison of skin prick tests, intradermal skin tests, and specific IgE in the diagnosis of mouse allergy.J Allergy Clin Immunol. 2008 Apr;121(4):933-9. doi: 10.1016/j.jaci.2008.01.023. Epub 2008 Mar 6. J Allergy Clin Immunol. 2008. PMID: 18325579
-
Mouse allergen-specific immunoglobulin G and immunoglobulin G4 and allergic symptoms in immunoglobulin E-sensitized laboratory animal workers.Clin Exp Allergy. 2005 Oct;35(10):1347-53. doi: 10.1111/j.1365-2222.2005.02331.x. Clin Exp Allergy. 2005. PMID: 16238795
-
Mouse allergen-specific immunoglobulin G4 and risk of mouse skin test sensitivity.Clin Exp Allergy. 2006 Aug;36(8):1097-103. doi: 10.1111/j.1365-2222.2006.02534.x. Clin Exp Allergy. 2006. PMID: 16911366
-
IgE antibodies in occupational asthma: are they causative or an associated phenomenon?Curr Opin Allergy Clin Immunol. 2014 Apr;14(2):100-5. doi: 10.1097/ACI.0000000000000041. Curr Opin Allergy Clin Immunol. 2014. PMID: 24500297 Review.
Cited by
-
Experiences from occupational exposure limits set on aerosols containing allergenic proteins.Ann Occup Hyg. 2012 Oct;56(8):888-900. doi: 10.1093/annhyg/mes035. Epub 2012 Jul 28. Ann Occup Hyg. 2012. PMID: 22843406 Free PMC article.
-
Environmental assessment and exposure reduction of rodents: a practice parameter.Ann Allergy Asthma Immunol. 2012 Dec;109(6):375-87. doi: 10.1016/j.anai.2012.09.019. Ann Allergy Asthma Immunol. 2012. PMID: 23176873 Free PMC article. No abstract available.
-
Laboratory Animal Allergy in the Modern Era.Curr Allergy Asthma Rep. 2015 Dec;15(12):73. doi: 10.1007/s11882-015-0575-4. Curr Allergy Asthma Rep. 2015. PMID: 26496763 Review.
-
Associations between serum folate and vitamin D levels and incident mouse sensitization in adults.J Allergy Clin Immunol. 2014 Feb;133(2):399-404. doi: 10.1016/j.jaci.2013.09.042. Epub 2013 Nov 28. J Allergy Clin Immunol. 2014. PMID: 24290285 Free PMC article.
-
Predictors for Increased and Reduced Rat and Mouse Allergen Exposure in Laboratory Animal Facilities.Ann Work Expo Health. 2018 Oct 15;62(8):953-965. doi: 10.1093/annweh/wxy060. Ann Work Expo Health. 2018. PMID: 29982271 Free PMC article.
References
-
- Platts-Mills T, Vaughan J, Squillace S, Woodfolk J, Sporik R. Sensitisation, asthma, and a modified Th2 response in children exposed to cat allergen: a population-based cross-sectional study. Lancet. 2001;357:752–6. - PubMed
-
- Custovic A, Hallam CL, Simpson BM, Craven M, Simpson A, Woodcock A. Decreased prevalence of sensitization to cats with high exposure to cat allergen. J Allergy Clin Immunol. 2001;108:537–9. - PubMed
-
- Custovic A, Simpson BM, Simpson A, et al. Current mite, cat, and dog allergen exposure, pet ownership, and sensitization to inhalant allergens in adults. J Allergy Clin Immunol. 2003;111:402–7. - PubMed
-
- Almqvist C, Egmar AC, Hedlin G, et al. Direct and indirect exposure to pets - risk of sensitization and asthma at 4 years in a birth cohort. Clin Exp Allergy. 2003;33:1190–7. - PubMed
Publication types
MeSH terms
Substances
Grants and funding
LinkOut - more resources
Full Text Sources
Medical
