. 2011 Aug;34(8):430-42.
doi: 10.1016/j.tins.2011.05.005. Epub 2011 Jun 21.

Neuroimaging markers for the prediction and early diagnosis of Alzheimer's disease dementia

Affiliations

Neuroimaging markers for the prediction and early diagnosis of Alzheimer's disease dementia

Michael Ewers et al. Trends Neurosci. 2011 Aug.

Abstract

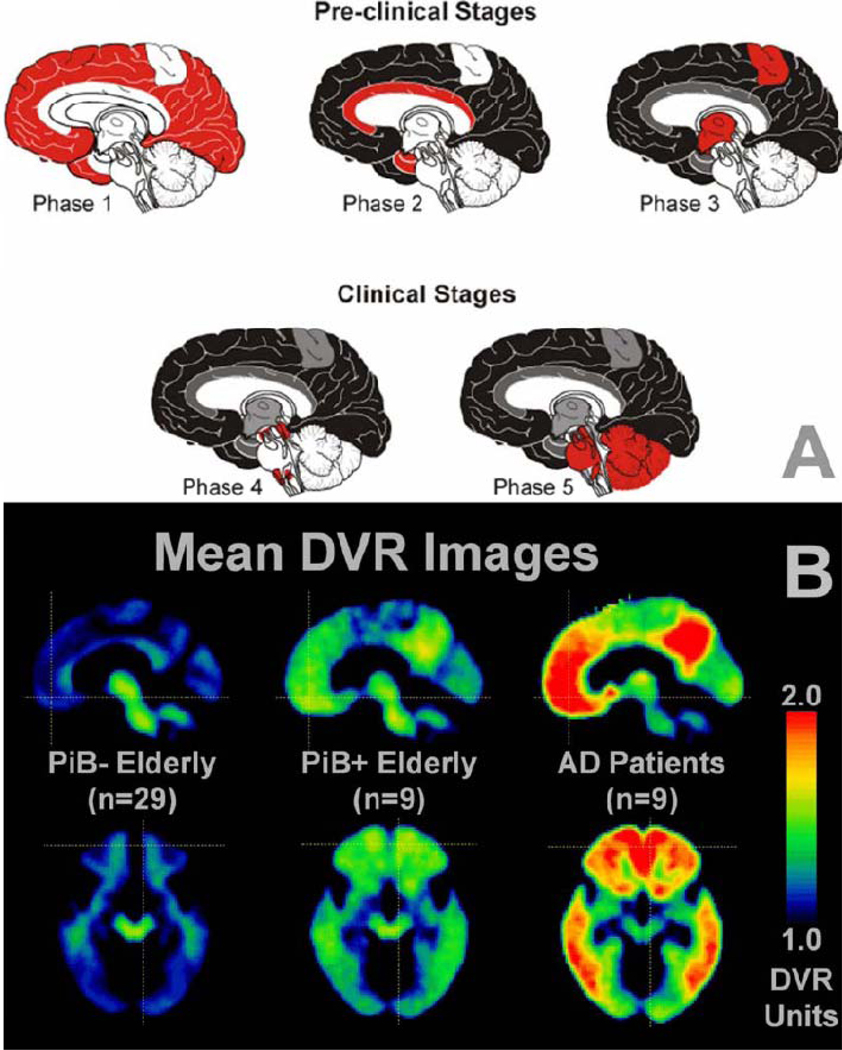
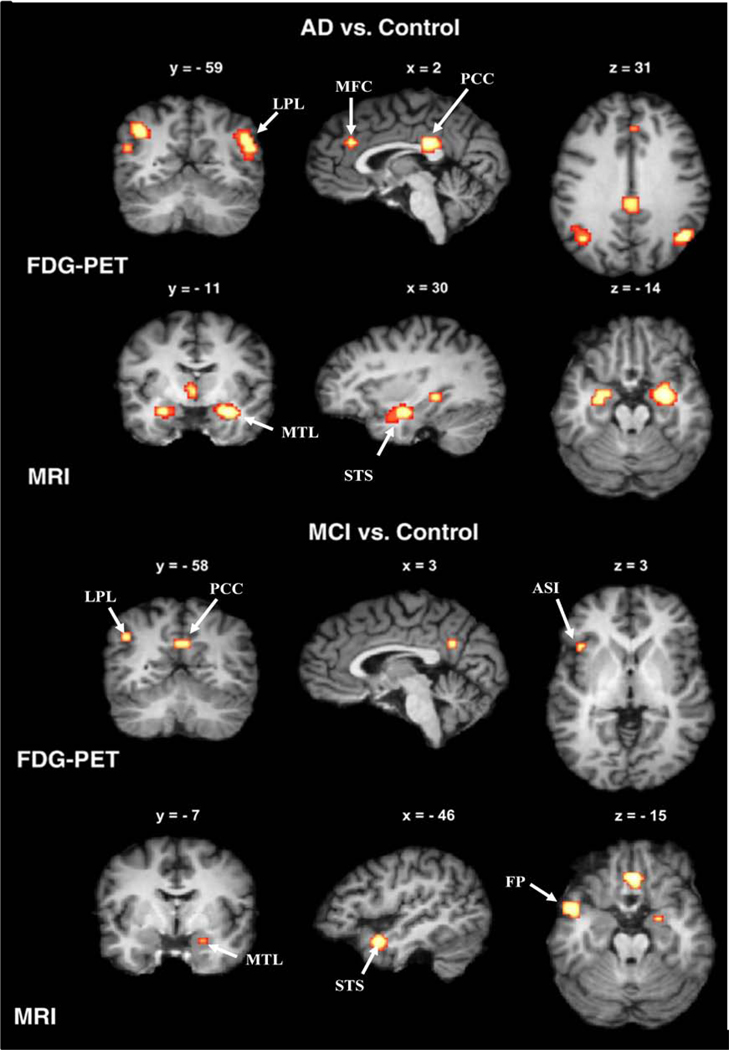
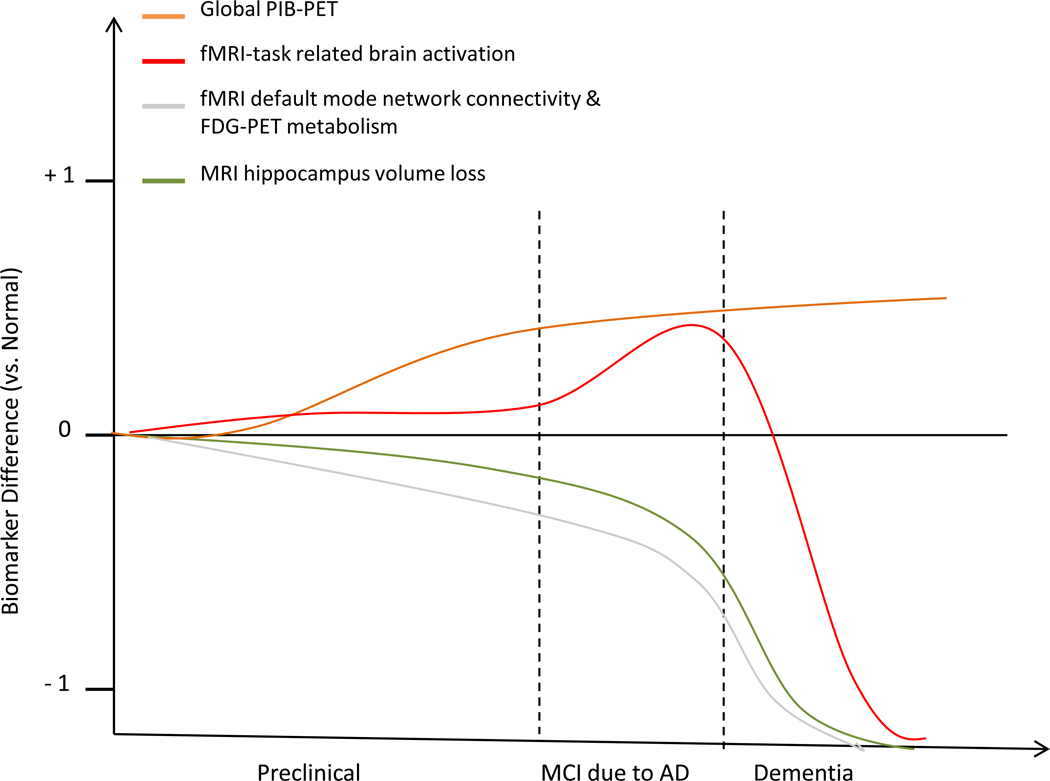
Alzheimer's disease (AD) is a progressive age-related neurodegenerative disease. At the time of clinical manifestation of dementia, significant irreversible brain damage is already present, rendering the diagnosis of AD at early stages of the disease an urgent prerequisite for therapeutic treatment to halt, or at least slow, disease progression. In this review, we discuss various neuroimaging measures that are proving to have potential value as biomarkers of AD pathology for the detection and prediction of AD before the onset of dementia. Recent studies that have identified AD-like structural and functional brain changes in elderly people who are cognitively within the normal range or who have mild cognitive impairment (MCI) are discussed. A dynamic sequence model of changes that occur in neuroimaging markers during the different disease stages is presented and the predictive value of multimodal neuroimaging for AD dementia is considered.


Figures

Figure 1
Figure 1. The progression of amyloid deposits as assessed at different stages of AD in (A) post-mortem brain tissue using immunohistochemical techniques against Aβ and (B) in vivo amyloid-PET scans
(A) Phases (1–5) of postmortem histological appearance of Aβ in clinical AD, as based on [125]. Note that the stages refer to Aβ brain deposition and not necessarily to clinical severity. In Phase 1, Aβ is largely restricted to neocortical brain areas. In phases 2 and 3, when clinical signs of cognitive decline have yet to appear, Aβ deposits are localized throughout the neocortex, allortex, including brain areas such as the medial temporal lobe, and also begin to occur in the motor cortex and subcortical brain structures. In the clinical stages of AD (phase 4 & 5), Aβ deposits are observed globally in the brain including the brain stem and the cerebellum in the final stage of the disease (phase 5). Key: white, no Aβ deposits; red, novel Aβ deposition; grey, Aβ deposits that were missing in phase 1; black, Aβ deposits that were present already in phase 1 (B) A similar spatial pattern of progression of Aβ deposition is observed when using PiB-PET in cognitively normal elderly controls who appear to be Aβ-free (PiB−), cognitively normal elderly controls who appear to be in the early stages of Aβ deposition (PiB+) and in symptomatic AD patients [18]. Mean sagittal distribution volume ratio (DVR; cerebellum as reference) images are at the top and transaxial images at the bottom. Reproduced, with permission, from [125] (A) and [18] (B).
Figure 2
Figure 2. Brain regions of functional and structural brain abnormalities that show strongest effects for the diagnosis and prognosis of AD dementia
Yellow-to-red labeled clusters show significantly decreased activity, as measured by FDG-PET (first and third row), and reduced grey matter volume, as measured by structural MRI (second and last row) in AD subjects (top half) and MCI subjects (bottom half) as compared to elderly cognitively normalcontrol subjects in a meta-analysis of voxel-based MRI and FDG-PET studies [47]. Note that in AD subjects, reduced FDG-PET is present in clusters of the posterior cingulum cortex (PCC), lateral parietal lobe (LPL), and medial frontal cortex (MFC), (top row), and is already present in the inferior PLP and PCC at the stage of MCI, in addition to a small cluster in the anterior superior insula (ASI) The majority of the grey matter volume decreases in AD appear in the medial temporal lobe (MTL) extending towards the superior temporal sulcus (STS), and these volume reductions are already present to a smaller extent in MCI subjects. Clusters of significant group differences were projected onto standardized MRI images of brain slices in coronal view (left column), sagittal view (middle column), and axial view (right column). The x, y, and z values label the slice coordinates within the standard Talairach atlas space. Adapted, with permission, from [47].
Box 2 Figure I
Box 2 Figure I
Hypothetical model of various different neuroimaging biomarkers and their predicted utility during disease progression, as based on a variety of studies discussed in this review.

References

    1. Ott A, et al. Incidence and risk of dementia. The Rotterdam Study. Am J Epidemiol. 1998;147:574–580. - PubMed
    1. Seshadri S, et al. Operationalizing diagnostic criteria for Alzheimer's disease and other age-related cognitive impairment-Part 2. Alzheimers Dement. 2011;7:35–52. - PMC - PubMed
    1. Dubois B, et al. Research criteria for the diagnosis of Alzheimer's disease: revising the NINCDS-ADRDA criteria. Lancet neurology. 2007;6:734–746. - PubMed
    1. Dubois B, et al. Revising the definition of Alzheimer's disease: a new lexicon. Lancet Neurol. 2010;9:1118–1127. - PubMed
    1. Pastor P, and Goate AM. Molecular genetics of Alzheimer's disease. Curr Psychiatry Rep. 2004;6:125–133. - PubMed

Publication types