. 2011 Jun 22;31(25):9264-78.
doi: 10.1523/JNEUROSCI.5796-10.2011.

Controlling specific locomotor behaviors through multidimensional monoaminergic modulation of spinal circuitries

Affiliations

Controlling specific locomotor behaviors through multidimensional monoaminergic modulation of spinal circuitries

Pavel Musienko et al. J Neurosci. .

Abstract

Descending monoaminergic inputs markedly influence spinal locomotor circuits, but the functional relationships between specific receptors and the control of walking behavior remain poorly understood. To identify these interactions, we manipulated serotonergic, dopaminergic, and noradrenergic neural pathways pharmacologically during locomotion enabled by electrical spinal cord stimulation in adult spinal rats in vivo. Using advanced neurobiomechanical recordings and multidimensional statistical procedures, we reveal that each monoaminergic receptor modulates a broad but distinct spectrum of kinematic, kinetic, and EMG characteristics, which we expressed into receptor-specific functional maps. We then exploited this catalog of monoaminergic tuning functions to devise optimal pharmacological combinations to encourage locomotion in paralyzed rats. We found that, in most cases, receptor-specific modulatory influences summed near algebraically when stimulating multiple pathways concurrently. Capitalizing on these predictive interactions, we elaborated a multidimensional monoaminergic intervention that restored coordinated hindlimb locomotion with normal levels of weight bearing and partial equilibrium maintenance in spinal rats. These findings provide new perspectives on the functions of and interactions between spinal monoaminergic receptor systems in producing stepping, and define a framework to tailor pharmacotherapies for improving neurological functions after CNS disorders.


Figures

Figure 1.
Figure 1.
Experimental setup and statistical procedures. A, Spinal rats were positioned bipedally in a robotically controlled supporting system. Using reflective markers overlying specific joints (MTP), a force plate located below the treadmill belt, and chronic intramuscular recording electrodes and epidural stimulating electrodes (EES), we measured detailed kinematics, kinetics, and EMG features underlying continuous hindlimb stepping on a treadmill. B, Wires for EES were routed below the spinous processes and sutured over the dura on the dorsal aspect of the L2 and S1 spinal segments. C, Timeline for the entire study and for individual testing sessions. D–F, Representative illustrations of kinematics, kinetics, and EMG features underlying spontaneous and EES-enabled locomotion recorded at 6 weeks after lesion. The same rat is shown in E and F, with and without the presence of dual-site EES. Representative color-coded stick diagram decomposition of hindlimb motion during stance (black), paw dragging (red), and swing (blue) is shown for each condition together with successive (n = 10) trajectories of the limb endpoint (MTP marker). In these drawings, the arrows represent the direction and intensity of limb endpoint velocity at swing onset. A sequence of raw EMG activity from the TA and MG muscles and the changes in vertical ground reaction forces is shown at the bottom. The gray and red boxes indicate the duration of stance and drag phases bilaterally, while open areas indicate the duration of the swing phase. Averaged (n = 10 steps) rectified EMG activity, vertical forces, and stance period durations are displayed nearby the raw data in the rightmost plots. G, Multistep statistical procedures to extract intervention-specific parameters. Step 1, Quantification of kinematics, kinetics, and EMG features (129 variables measured) for each rat. Step 2, PC analysis was applied on each rat independently (all sessions) or on all rats and sessions simultaneously. Bar graphs indicate the amount of variance explained by each PC for individual (top; means + SEM) and collective (bottom) PC analyses. Step 3, Three-dimensional, PC-based statistical representation of spontaneous locomotion and EES-enabled stepping recorded in all rats (n = 7) during several recording sessions (5–8 weeks). Each point represents a single gait cycle from an individual rat under a given condition (total gait cycles, 979). In this representation, the discrepancy between locomotor features increases with the distance between data points, and inversely, data points indicating similar gait patterns are in close proximity. In the bottom plot, least-squares spheres are traced for each condition to emphasize the clear differences between statistically extracted gait patterns under specific interventions. The bar graph shows the average (n = 7 rats) scores along PC1, which correspond to the coordinates of data points along the axis that accounted for the largest amount of the total variance. These scores indicate the degree of difference versus similarity between conditions. Step 4, Color-coded representation of factor loadings (i.e., correlation values between each variable) and PC1 that identify the variables that contribute most to the differences observed between the experimental conditions. PC2 and PC3, instead, were related to idiosyncratic gait features, varied locomotor performances, and step-to-step variability. Factor loadings extracted for each rat independently are represented in successive columns. The last column shows averaged factor loadings and thus identifies parameters modulated consistently across rats (i.e., the most relevant variables). Interrelated parameters can then be regrouped into functional clusters (see Materials and Methods). Step 5, Bar graphs of mean (n = 7 rats) values for the most relevant variables identified in step 4. BWS, Body weight support. Error bars indicate SEM. The asterisks indicate significantly different at **p < 0.01 and ***p < 0.005, respectively.
Figure 2.
Figure 2.
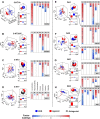
Receptor-specific modulation of stepping patterns enabled by EES in spinal rats. Representative characteristics of stepping patterns recorded during EES alone (A), and after the administration of agonists or antagonists to specific 5-HT, DA, and NA receptor subtypes, as indicated above each panel (B–K). Conventions are the same as in Figure 1. The same rat is shown in all panels.
Figure 3.
Figure 3.
Statistical representation of receptor-specific modulation of stepping patterns. A–H, For each monoaminergic receptor system independently, PC analysis was applied on all gait cycles recorded from all rats (n = 7) under EES alone, under EES and a given agonist, and under EES and the respective antagonist. Representations and conventions are the same as in Figure 1. Each 3-D plot has been rotated to adequately visualize discrepancies between the locations of gait cycles associated with the different experimental conditions. Each point represents a gait cycle under a given condition. Data points clustered in distinct spatial locations, revealing that pharmacological interventions modulated locomotor patterns in the same direction in all the rats, regardless of the initial stepping performance or idiosyncratic gait features. The bar graphs show average (n = 7 rats) scores along PC1 and PC2. PC1 captures the main effects of the drugs, whereas PC2 (not significant, except for NA2) and PC3 (data not shown) are related to differences between rats' performances and step-to-step variability. Next to each plot, we regrouped parameters with factor loadings superior to 0.6 into functional clusters or locomotor subfunctions: generation facilitation of locomotion (L), reproducibility (R), coordination (C), forces (Fc), extension (E), flexion (F), and stability (S). The number of variables represented in each cluster and the intensity of the color indicate, for each monoaminergic receptor, the specifically tuned locomotor subfunctions and the amplitude of this modulation. Error bars indicate SEM. The asterisks indicate significantly different (***p < 0.005) from all other nonmarked conditions.
Figure 4.
Figure 4.
Selected kinematics, kinetics, and EMG features of locomotor patterns. Bar graphs of average values (n = 7 rats, 10 steps from the right limb per rat) for selected kinematics (as indicated above each panel A1–A8), (A), EMG (as indicated above each panel B1B4), and stability (kinetics and kinematics) (as indicated above each panelC1C4) parameters that were more frequently identified as relevant variables by PC analysis to account for receptor-specific gait pattern modulations. These variables were obtained by averaging factor loadings across all experimental conditions and sorting those parameters with the largest values. However, redundant or similar variables were excluded. With the exception of interlimb coordination (A2), all values were normalized to the mean values recorded for each rat during stepping facilitated by EES alone on the same day of testing (horizontal gray dotted line). The solid line in A2 represents the value (−0.5) underlying a perfect alternated (out-of-phase) coupling between the left and right hindlimbs. For each parameter, the actual mean value for all sessions and rats is reported within the box attached to the right aspect of the baseline. Data from noninjured rats were normalized to the grand average of values recorded during stepping with EES in all rats for all recording sessions. For weight-bearing levels, a value of 50% corresponds to full weight-bearing hindlimb locomotion, as recorded in noninjured rats walking in a bipedal posture. Combo 1, 5-HT1A plus 5-HT7. Combo 2, 5-HT1A plus 5-HT7 plus 5-HT2A/C. Combo 3, 5-HT1A plus 5-HT7 plus 5-HT2A/C plus DA1. Combo 4, 5-HT1A plus 5-HT7 plus 5-HT2A/C plus DA1 plus NA2an. Error bars indicate SEM. The asterisks indicate significantly different from EES baseline at *p < 0.05, **p < 0.01, and ***p < 0.005, respectively.
Figure 5.
Figure 5.
Functional maps underlying gait pattern modulations mediated by monoaminergic interventions. A, Color-coded representation of factor loadings associated with PC1 (i.e., correlations between the different variables and the component that accounted for 30–50% of the total variance), as reported below each column as the mean ± SEM. Factor loadings were computed in each rat independently, averaged across rats (n = 7 rats), and represented as a mean for each receptor and each combinatorial intervention in the successive columns. The last column shows averaged factor loadings obtained for noninjured (healthy) rats (n = 8 rats). B, Correlation between factor loadings underlying locomotion of noninjured rats (n = 8 rats), stepping enabled by EES in spinal rats (left) or by EES and the full monoaminergic combinatorial intervention (combo 4; right). Regression lines and values of regression coefficients are reported in the respective graphs. C1–C4, Selected details of functional maps represented in A. Submaps were chosen to illustrate the three main tuning schemes underlying the modulation of stepping patterns under the combined interventions (i.e., preservative, summative, and synergistic tuning), which are ordered vertically. The actual value for each factor loading and condition is reported in the corresponding colored box. Amp., Amplitude; Kin., kinematics; coor., coordination; osc., oscillation; int., integral.
Figure 6.
Figure 6.
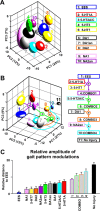
Interactive monoaminergic strategies mediate unique in vivo functional states of the spinal circuitry. A, Three-dimensional representation of stepping patterns recorded during locomotion facilitated by EES alone (1) and in conjunction with the monoaminergic receptors investigated (2–10) for a representative spinal rat. Conventions are the same as in Figure 1. Each experimental condition is color-coded and identified by a number that is reported in the nearby legend. B, Three-dimensional representation of stepping patterns recorded during locomotion facilitated by EES alone (1) and various combinations of monoaminergic agents (2–10) for a representative spinal rat. Data from a noninjured rat also are reported (11). C, Quantification of the relative capacities of individual pharmacological interventions and their combinations to modulate locomotion enabled by EES. This capacity was evaluated for each rat independently (n = 7 rats) as the 3-D distance between the EES condition and each monoaminergic intervention in the space created by PC1–3 when applying PC analysis on all conditions simultaneously. The color coding used in A and B has been implemented to differentiate the experimental conditions.
Figure 7.
Figure 7.
The concurrent manipulation of multiple monoaminergic pathways powerfully modulates stepping patterns. Representative features of gait patterns recorded during locomotion enabled by EES and modulated by increasingly complex combinations of agonists and antagonists to 5-HT, DA, and NA receptor subtypes are shown. A–F, From left to right, the successive panels show locomotor features resulting from manipulating one additional monoaminergic pathway compared with the previous panel as indicated above each panel. In addition to parameters detailed in Figure 1, EMG activity from proximal extensor (VL) and flexor (St) muscles and changes in whole-limb oscillations and ground reaction forces in the mediolateral direction are displayed. The entire limb is defined as the virtual segment connecting the crest to the MTP marker. At the bottom, plots show the density distribution of CoP displacements in anteroposterior and mediolateral directions for each experimental condition. Values are centered (0, 0) on the average position of the pelvis over the duration of the stance phase. The same spinal rat is shown in all the panels, except for the rightmost representation that shows data from a noninjured rat for comparison. G, Bar graphs of average values (n = 7 rats, 10 steps from the right limb per rat) for the SD of CoP displacements in the mediolateral direction during stance of the right limb. Error bars indicate SEM. The asterisk indicates significantly different from all the other conditions at *p < 0.05.
Figure 8.
Figure 8.
Schematic summary of specific monoaminergic tuning functions and interactions between monoaminergic receptor systems in modulating locomotion of spinal rats. A, Representation of receptor-specific tuning function and their interactions. The size of each circle is proportional to the respective ability of each serotonergic, dopaminergic, and noradrenergic receptor subtype to modulate gait features toward those underlying locomotion of healthy rats (rightmost circle). Since many of the computed kinematic, kinetic, and EMG parameters were associated with similar aspects of locomotion, we regrouped interrelated gait features under a common label or subfunction. We thus distinguished six locomotor subfunctions: reproducibility, extension, flexion, coordination, forces, and stability, as shown for the cluster analysis (Fig. 3). The presence and size of the color-coded arrows around each studied receptor, respectively, indicate the modulation of the related subfunction and the amplitude of this tuning. Combinations 1–4 correspond to the combinatorial monoaminergic interventions (combos 1–4) described in Figure 7. This schematic representation highlights that each of the investigated monoaminergic pathways show the ability to tune unique locomotor subfunctions with distinct modulatory amplitude and that these tuning functions can sum when manipulating multiple pathways simultaneously. B, Theoretical motor functions X–Z are represented within receptors R1 and R2. For each function, the background has been colored if the receptor has the ability to tune this specific function. The intensity of the color represents the amplitude of the modulation. The modulation of functions X–Z with combinatorial interventions of receptors R1 and R2 obey to predictive tuning schemes (preservative, summative, and synergistic) that are shown in the frame R1 + R2.

References

    1. Agnati LF, Fuxe K. Volume transmission as a key feature of information handling in the central nervous system possible new interpretative value of the Turing's B-type machine. Prog Brain Res. 2000;125:3–19. - PubMed
    1. Agnati LF, Guidolin D, Guescini M, Genedani S, Fuxe K. Understanding wiring and volume transmission. Brain Res Rev. 2010;64:137–159. - PubMed
    1. Antri M, Mouffle C, Orsal D, Barthe JY. 5-HT1A receptors are involved in short- and long-term processes responsible for 5-HT-induced locomotor function recovery in chronic spinal rat. Eur J Neurosci. 2003;18:1963–1972. - PubMed
    1. Barbeau H, Rossignol S. Initiation and modulation of the locomotor pattern in the adult chronic spinal cat by noradrenergic, serotonergic and dopaminergic drugs. Brain Res. 1991;546:250–260. - PubMed
    1. Carhart MR, He J, Herman R, D'Luzansky S, Willis WT. Epidural spinal-cord stimulation facilitates recovery of functional walking following incomplete spinal-cord injury. IEEE Trans Neural Syst Rehabil Eng. 2004;12:32–42. - PubMed

Publication types

Substances