

Comparing the kinetics of NK cells, CD4, and CD8 T cells in murine cytomegalovirus infection
- PMID: 21697462
- PMCID: PMC3771860
- DOI: 10.4049/jimmunol.1100416
Comparing the kinetics of NK cells, CD4, and CD8 T cells in murine cytomegalovirus infection
Abstract
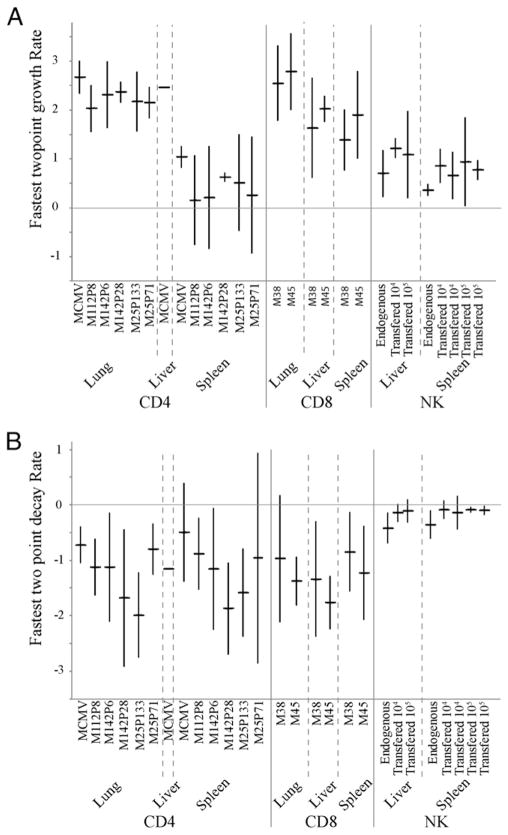
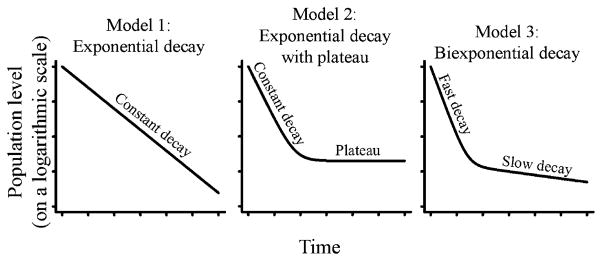
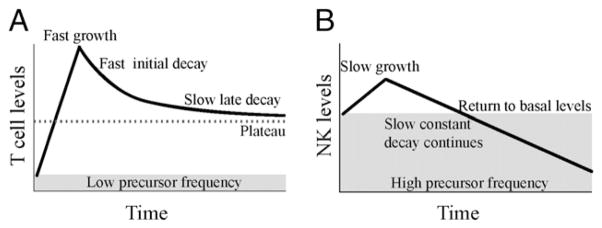
NK cells recognize virus-infected cells with germline-encoded activating and inhibitory receptors that do not undergo genetic recombination or mutation. Accordingly, NK cells are often considered part of the innate immune response. The innate response comprises rapid early defenders that do not form immune memory. However, there is increasing evidence that experienced NK cells provide increased protection to secondary infection, a hallmark of the adaptive response. In this study, we compare the dynamics of the innate and adaptive immune responses by examining the kinetic profiles of the NK and T cell response to murine CMV infection. We find that, unexpectedly, the kinetics of NK cell proliferation is neither earlier nor faster than the CD4 or CD8 T cell response. Furthermore, early NK cell contraction after the peak of the response is slower than that of T cells. Finally, unlike T cells, experienced NK cells do not experience biphasic decay after the response peak, a trait associated with memory formation. Rather, NK cell contraction is continuous, constant, and returns to below endogenous preinfection levels. This indicates that the reason why Ag-experienced NK cells remain detectable for a prolonged period after adoptive transfer and infection is in part due to the high precursor frequency, slow decay rate, and low background levels of Ly49H(+) NK cells in recipient DAP12-deficient mice. Thus, the quantitative contribution of Ag-experienced NK cells in an endogenous secondary response, with higher background levels of Ly49H(+) NK cells, may be not be as robust as the secondary response observed in T cells.
Conflict of interest statement
The authors have no financial conflicts of interest.
Figures


Similar articles
-
The specific NK cell response in concert with perforin prevents CD8(+) T cell-mediated immunopathology after mouse cytomegalovirus infection.Med Microbiol Immunol. 2015 Jun;204(3):335-44. doi: 10.1007/s00430-015-0409-y. Epub 2015 Mar 26. Med Microbiol Immunol. 2015. PMID: 25809566
-
The NK cell response to mouse cytomegalovirus infection affects the level and kinetics of the early CD8(+) T-cell response.J Virol. 2012 Feb;86(4):2165-75. doi: 10.1128/JVI.06042-11. Epub 2011 Dec 7. J Virol. 2012. PMID: 22156533 Free PMC article.
-
NK1.1+ cells and murine cytomegalovirus infection: what happens in situ?J Immunol. 2001 Feb 1;166(3):1796-802. doi: 10.4049/jimmunol.166.3.1796. J Immunol. 2001. PMID: 11160226
-
Molecular characterization of HCMV-specific immune responses: Parallels between CD8(+) T cells, CD4(+) T cells, and NK cells.Eur J Immunol. 2015 Sep;45(9):2433-45. doi: 10.1002/eji.201545495. Epub 2015 Aug 24. Eur J Immunol. 2015. PMID: 26228786 Review.
-
Innate immunity regulates adaptive immune response: lessons learned from studying the interplay between NK and CD8+ T cells during MCMV infection.Med Microbiol Immunol. 2012 Nov;201(4):487-95. doi: 10.1007/s00430-012-0263-0. Epub 2012 Sep 11. Med Microbiol Immunol. 2012. PMID: 22965169 Free PMC article. Review.
Cited by
-
Spatial kinetics and immune control of murine cytomegalovirus infection in the salivary glands.PLoS Comput Biol. 2024 Aug 16;20(8):e1011940. doi: 10.1371/journal.pcbi.1011940. eCollection 2024 Aug. PLoS Comput Biol. 2024. PMID: 39150988 Free PMC article.
-
Murine cytomegalovirus promotes renal allograft inflammation via Th1/17 cells and IL-17A.Am J Transplant. 2022 Oct;22(10):2306-2322. doi: 10.1111/ajt.17116. Epub 2022 Jun 15. Am J Transplant. 2022. PMID: 35671112 Free PMC article.
-
Costimulatory molecule DNAM-1 is essential for optimal differentiation of memory natural killer cells during mouse cytomegalovirus infection.Immunity. 2014 Feb 20;40(2):225-34. doi: 10.1016/j.immuni.2013.12.011. Epub 2014 Jan 16. Immunity. 2014. PMID: 24440149 Free PMC article.
-
Activated CD4+ and CD8+ T Cell Proportions in Multiple Sclerosis Patients.Inflammation. 2016 Dec;39(6):2040-2044. doi: 10.1007/s10753-016-0441-0. Inflammation. 2016. PMID: 27596006
-
Natural Killer Cell-Derived IL-10 Prevents Liver Damage During Sustained Murine Cytomegalovirus Infection.Front Immunol. 2019 Nov 15;10:2688. doi: 10.3389/fimmu.2019.02688. eCollection 2019. Front Immunol. 2019. PMID: 31803193 Free PMC article.
References
-
- Medzhitov R. Recognition of microorganisms and activation of the immune response. Nature. 2007;449:819–826. - PubMed
-
- Arstila TP, Casrouge A, Baron V, Even J, Kanellopoulos J, Kourilsky P. A direct estimate of the human alphabeta T cell receptor diversity. Science. 1999;286:958–961. - PubMed
-
- Davis MM, Bjorkman PJ. T-cell antigen receptor genes and T-cell recognition. Nature. 1988;334:395–402. - PubMed
-
- Venturi V, Price DA, Douek DC, Davenport MP. The molecular basis for public T-cell responses? Nat Rev Immunol. 2008;8:231–238. - PubMed
Publication types
MeSH terms
Grants and funding
LinkOut - more resources
Full Text Sources
Other Literature Sources
Research Materials
