. 2011 Aug 15;22(16):2886-99.
doi: 10.1091/mbc.E10-10-0862. Epub 2011 Jun 22.

Arp2/3 promotes junction formation and maintenance in the Caenorhabditis elegans intestine by regulating membrane association of apical proteins

Affiliations

Arp2/3 promotes junction formation and maintenance in the Caenorhabditis elegans intestine by regulating membrane association of apical proteins

Yelena Y Bernadskaya et al. Mol Biol Cell. .

Abstract

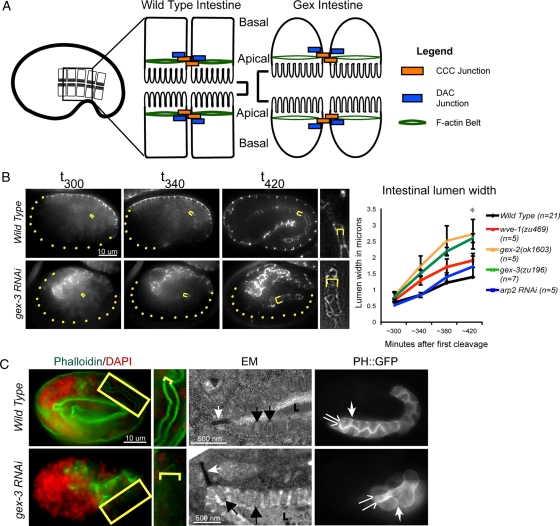
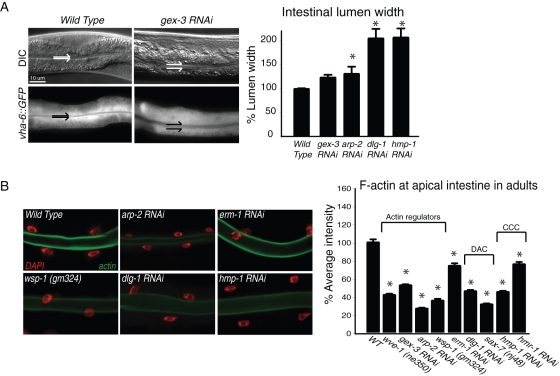
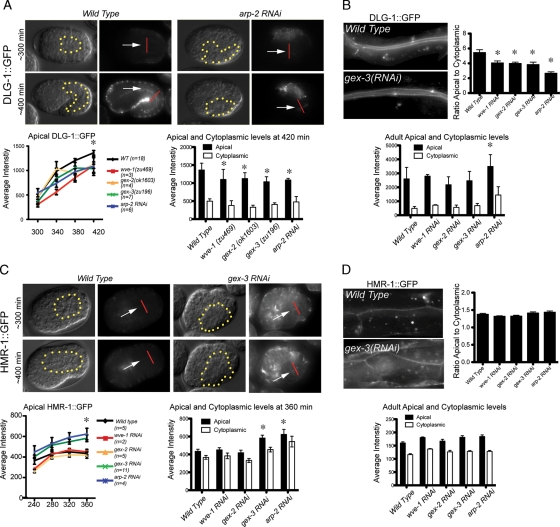
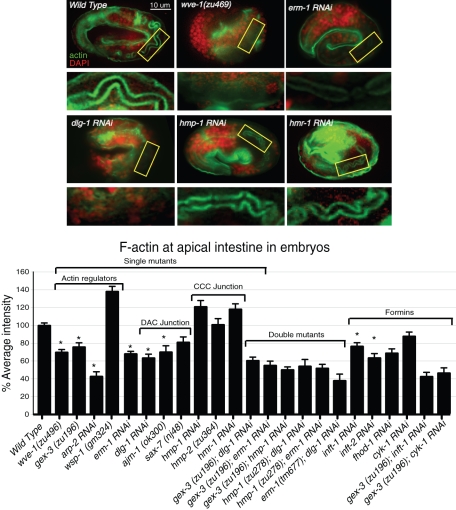
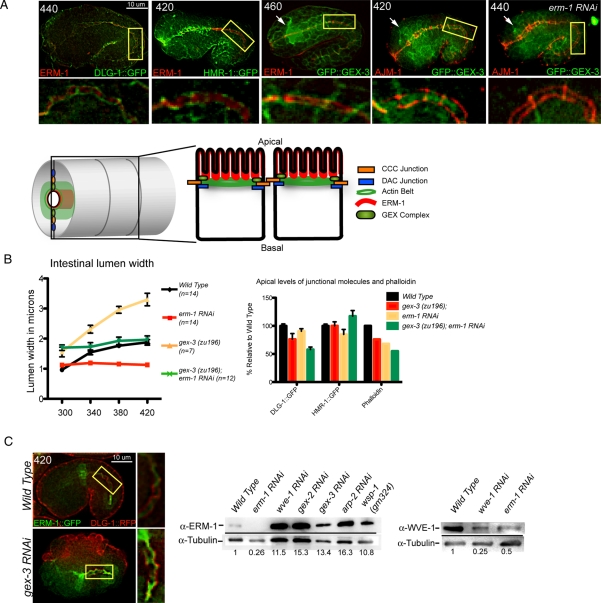
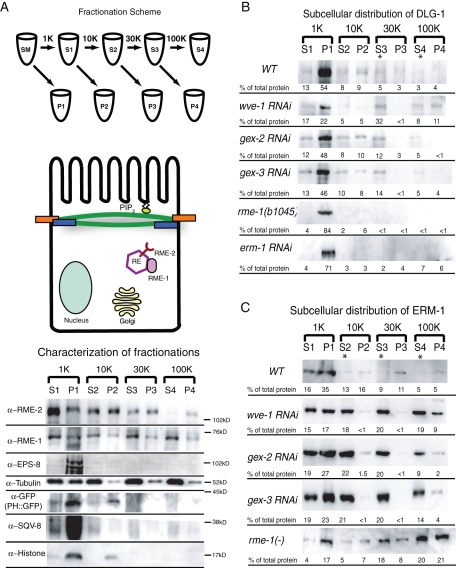
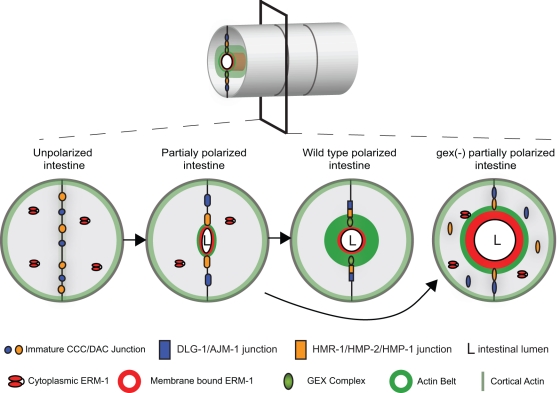
It has been proposed that Arp2/3, which promotes nucleation of branched actin, is needed for epithelial junction initiation but is less important as junctions mature. We focus here on how Arp2/3 contributes to the Caenorhabditis elegans intestinal epithelium and find important roles for Arp2/3 in the maturation and maintenance of junctions in embryos and adults. Electron microscope studies show that embryos depleted of Arp2/3 form apical actin-rich microvilli and electron-dense apical junctions. However, whereas apical/basal polarity initiates, apical maturation is defective, including decreased apical F-actin enrichment, aberrant lumen morphology, and reduced accumulation of some apical junctional proteins, including DLG-1. Depletion of Arp2/3 in adult animals leads to similar intestinal defects. The DLG-1/AJM-1 apical junction proteins, and the ezrin-radixin-moesin homologue ERM-1, a protein that connects F-actin to membranes, are required along with Arp2/3 for apical F-actin enrichment in embryos, whereas cadherin junction proteins are not. Arp2/3 affects the subcellular distribution of DLG-1 and ERM-1. Loss of Arp2/3 shifts both ERM-1 and DLG-1 from pellet fractions to supernatant fractions, suggesting a role for Arp2/3 in the distribution of membrane-associated proteins. Thus, Arp2/3 is required as junctions mature to maintain apical proteins associated with the correct membranes.


Figures

Figure 1:
Figure 1:
Arp2/3 is required during intestinal morphogenesis in C. elegans embryos. (A) Wild-type intestinal cells have apical junctions that recruit abundant F-actin; they pack together tightly and form a narrow intestinal lumen. Loss of Arp2/3 or WAVE/SCAR complex genes leads to the Gex, or gut on the exterior, morphogenesis phenotype. Gex intestinal cells recruit less actin at the apical junction; the cells are rounded and form an expanded intestinal lumen. (B) Live imaging to compare the intestinal lumen expansion in wild-type embryos and in embryos depleted of GEX pathway. Embryos are oriented with anterior to the left. The dlg-1::gfp transgene (Firestein and Rongo, 2001; Totong et al., 2007) is expressed at the apical junction of epithelial tissues during embryonic development, including the intestine (internal yellow brackets) and the epidermis (expression at the embryo surface). Yellow dots outline parts of the embryo not enclosed by epidermis. Yellow brackets indicate intestinal width. Right, a close-up of the intestine. Image contrast was enhanced equally to highlight intestinal width. Error bars show SEM. Asterisks indicate statistical significance, p < 0.05. (C) Left, phalloidin (green) was used to compare apical F-actin levels in wild-type and gex-3(RNAi) intestines. The yellow box around part of the intestine is amplified immediately to the right. Yellow brackets indicate intestinal lumen width. Middle, TEM of the intestine in wild-type and gex-3(RNAi) embryos. White arrows, apical adherens junctions; black arrows, microvilli; L, intestinal lumen. The white substance inside the lumen is the glycocalix. Right, the vha-6p::ph::gfp strain (labeled PH::GFP) was used to visualize cell membranes in wild-type and gex-3(RNAi) embryonic intestines. The split arrows illustrate the intestinal lumen width; the white single arrow points to lateral regions.
Figure 2:
Figure 2:
Arp2/3 maintains apical organization during postembryonic growth. (A) Adult intestines are shown by differential interference contrast (DIC) (top) and fluorescence optics (bottom). Split arrows indicate intestinal lumen width. Graph shows the lumen width of young adults in wild-type animals and in animals depleted of the WAVE-complex component GEX-3, ARP-2, or apical junction components. A strain that specifically marks the intestinal cells with GFP (vha-6p::GFP) facilitated measurement of the lumen width. (B) Postembryonic apical F-actin levels were detected with phalloidin (green) in dissected and fixed intestines. DAPI (red) indicates intestinal nuclei. Graphs: n > 15 adults for each genotype. Error bars show SEM. Asterisks mark statistical significance, p < 0.05. Values on the y-axis indicate fluorescence intensity in arbitrary units here and throughout the figures.
Figure 3:
Figure 3:
Arp2/3 regulates some apical junction components in embryos and adults. (A) Live imaging of DLG-1::GFP during intestinal morphogenesis. The same embryo is shown via DIC optics (left) and fluorescence (right). The levels of DLG-1::GFP were recorded in equally staged wild-type and mutant embryos every 40 min beginning at midembryogenesis. The dotted yellow line indicates the outline of the intestine. White arrows point to the developing apical intestine. The additional signal around the periphery of the embryos is from the DLG-1::GFP expression in the epidermis. The apical intestinal signal was calculated by placing a line (shown in red) across the intestine, and the maximum reading generated using the Line Function of ImageJ was recorded as the apical signal. The cytoplasmic signal was calculated as the average of the signal at the center of the two intestinal cells 2.5 μm on either side of the apical intestine. The graph on the left summarizes the average apical DLG-1::GFP levels in wild-type and Gex embryos; x-axis numbers indicate minutes after first cleavage. The graph on the right shows the average apical and cytoplasmic DLG-1::GFP levels in wild-type and Gex embryos at 420 min after first cleavage. (C) Live imaging of HMR-1::GFP during embryonic intestinal morphogenesis. Labeling, measurements, and graphs were done as in A, except the graph on the right shows the apical and cytoplasmic levels at 360 min after first cleavage. (B, D) DLG-1::GFP and HMR-1::GFP accumulation in adults. Top, the ratio of apical to cytoplasmic. Bottom, apical and cytoplasmic levels of DLG-1::GFP (B) and HMR-1::GFP (D) in the intestines of young adult worms were measured as described for the embryonic intestines. Micrographs show similarly staged worms expressing DLG-1::RFP and HMR-1::GFP. For each genotype n > 10 adult worms. Error bars show SEM. Asterisks indicate statistical significance, p < 0.05.
Figure 4:
Figure 4:
Apical enrichment of F-actin in the embryonic intestine requires the WAVE/SCAR complex, ERM-1, and the DLG-1/AJM-1 complex but not the cadherin/catenin complex. Embryos were stained with phalloidin to visualize F-actin (green) accumulation in the apical intestine in wild type and in embryos depleted of candidate regulators of apical morphogenesis. DAPI (red) labels nuclei. The apical region of the intestine (yellow rectangle) is amplified below each micrograph. Embryos at 550 min after first cleavage were compared. Actin regulators, including WAVE/SCAR components wsp-1, and arp-2, are shown. Double mutants were made by feeding RNAi for one gene to a strain carrying a genetic mutation in a second gene. RNAi effectiveness was verified by phenotypic assays. n ≥ 10 embryos for each genotype. Error bars show SEM. Asterisks indicate statistical significance, p < 0.05.
Figure 5:
Figure 5:
The WAVE/SCAR complex regulates intestinal morphogenesis through ERM-1. (A) Localization of WAVE proteins relative to ERM-1 and the apical junction. Fixed embryos doubly labeled with antibodies to ERM-1 (Hadwiger et al., 2010), AJM-1 (MH27) (Francis and Waterston, 1991; Koppen et al., 2001), and GFP (ab6556, Abcam) to visualize DLG-1::GFP (Totong et al., 2007) and a GFP::GEX-3–rescuing transgene (Soto et al., 2002). Age of embryos in minutes after first cleavage is indicated at upper left. All embryos are in a wild-type genetic background, except for the embryo at the right, which was depleted of ERM-1 via RNAi. White arrows point to the developing nerve ring, which in wild-type embryos has high GFP::GEX-3 expression. Image contrast was enhanced equally to better illustrate the subcellular localization. Section of the intestine in the yellow rectangle is amplified below the micrograph. The bright spot on the upper right corner of the rightmost embryo is nonspecific signal, visible in all channels. The model shows the location of ERM-1 (red) relative to WAVE/SCAR (light green) and the DAC junction (blue). (B) Comparison of the effects of WAVE and/or ERM-1 loss on apical intestine development. Left, embryos carrying the dlg-1::gfp transgene were used to monitor the width of the intestinal lumen over time in wild-type, erm-1(RNAi), gex-3(zu196), and gex-3(zu196);erm-1 (RNAi) strains. Right, comparison of changes in the apical DLG-1::GFP, HMR-1::GFP, and phalloidin levels in erm-1(RNAi), gex-3(zu196), and gex-3(zu196);erm-1 (RNAi) strains. Measurements of apical DLG-1::GFP and HMR-1::GFP were taken as described in Figure 3. Phalloidin data are from Figure 4. (C) WAVE and ERM-1 effects on each other's protein levels. Live embryos carrying two transgenes, DLG-1::RFP and ERM-1::GFP, imaged with wild type and reduced (gex-3 RNAi) WAVE complex. Magnified image of the intestine in the merged image is shown to the right. Image contrast was enhanced equally to better illustrate the localization, but quantitation was performed on raw images. Western blot analysis of ERM-1 levels in lysates depleted of branched actin regulators (middle) and of WVE-1 levels in lysates depleted of ERM-1 (right). Numbers below the blots show fold increase over wild type as normalized to tubulin and represent the average of two independent sets of lysates and three blots (ERM-1 Western) and three independent sets of lysates and seven blots (WVE-1 Western). Error bars show SEM. Asterisks mark statistical significance, p < 0.05.
Figure 6:
Figure 6:
Subcellular distribution of ERM-1 and DLG-1 depends on the WAVE complex. (A) Fractionation scheme and characterization of the supernatant and pellet fractions (see Materials and Methods for details). Pellets were resuspended so that they matched the volume of their partner supernatant fraction, then equal volumes of each S and P fraction were loaded so that relative amounts of each protein in the S vs. P fraction could be compared. Antibodies to specific subcellular components were used to characterize the fractions. RE, recycling endosome; SM, starting material. (B) Subcellular distribution of DLG-1 visualized with an antibody to GFP in wild-type, wve-1, gex-2, and gex-3 RNAi lysates and with an antibody to endogenous DLG-1 (Hadwiger et al., 2010) in rme-1(b1045) mutant and erm-1 RNAi lysates. (C) Subcellular distribution of ERM-1 visualized with an antibody to endogenous ERM-1 in wild-type and mutant lysates. Asterisks indicate a shift of protein from the pellet to the supernatant fraction in mutant lysates. The numbers below each band represent the relative percentage of total protein found in each fraction and are the average data from at least three Western blots representing at least two separate fractionation experiments for each genotype.
Figure 7:
Figure 7:
A developmental model for the role of Arp2/3 and ERM-1 in apical junction formation during development. Cross–sections of the intestinal tube are shown in developing wild-type and Gex embryos. Polarization of intestinal cells requires the assembly of the apical domain, including apical localization of the junctions, ERM-1, the WAVE/SCAR complex, and F-actin. ERM-1 helps to establish the apical region by binding to cortical F-actin before the apical junctions have fully formed, by localizing WAVE/SCAR apically, and by repositioning the apical junction proteins apicolaterally. When Arp2/3 is present the correct levels of ERM-1 accumulate at the apical plasma membrane, and junctional proteins can accumulate at their correct apicolateral locations. In the absence of Arp2/3 or its activator, the WAVE/SCAR complex, ERM-1 levels are highly elevated. The elevated ERM-1 may displace junctional proteins from the apical domain, leading to decreased junctional proteins at the membrane, less apical F-actin, and an expanded lumen width. Taken together, these defects result in a cell that is only partially polarized.

References

    1. Allen RD, Wolf RW. Membrane recycling at the cytoproct of Tetrahymena. J Cell Sci. 1979;35:217–227. - PubMed
    1. Audhya A, Desai A, Oegema K. A role for Rab5 in structuring the endoplasmic reticulum. J Cell Biol. 2007;178:43–56. - PMC - PubMed
    1. Bae YK, Kim E, L'Hernault SW, Barr MM. The CIL-1 PI 5-phosphatase localizes TRP polycystins to cilia and activates sperm in C. elegans. Curr Biol. 2009;19:1599–1607. - PMC - PubMed
    1. Benjamin JM, Kwiatkowski AV, Yang C, Korobova F, Pokutta S, Svitkina T, Weis WI, Nelson WJ. Alpha E-catenin regulates actin dynamics independently of cadherin-mediated cell-cell adhesion. J Cell Biol. 2010;189:339–352. - PMC - PubMed
    1. Bossinger O, Klebes A, Segbert C, Theres C, Knust E. Zonula adherens formation in Caenorhabditis elegans requires dlg-1, the homologue of the Drosophila gene discs large. Dev Biol. 2001;230:29–42. - PubMed

Publication types

MeSH terms