. 2012 Jan;6(1):71-80.
doi: 10.1038/ismej.2011.72. Epub 2011 Jun 23.

The significance of nitrogen cost minimization in proteomes of marine microorganisms

Affiliations

The significance of nitrogen cost minimization in proteomes of marine microorganisms

Joseph J Grzymski et al. ISME J. 2012 Jan.

Abstract

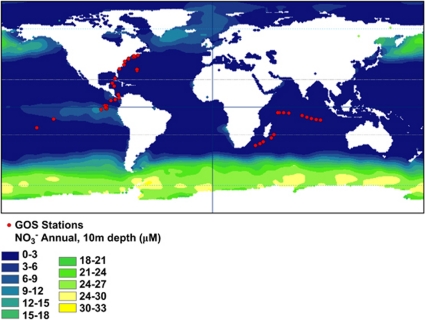
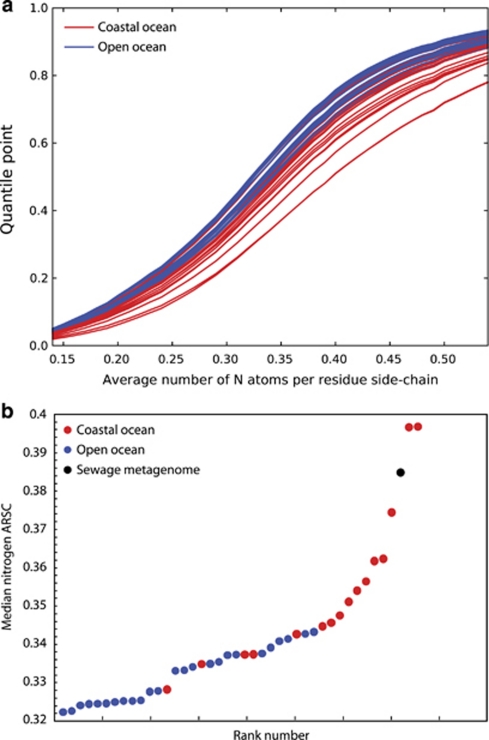
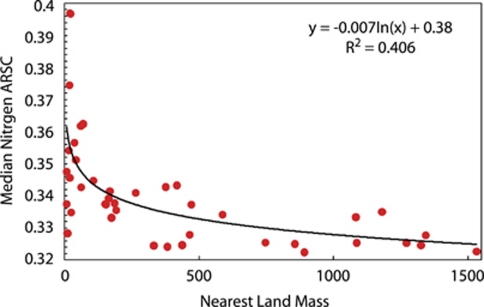
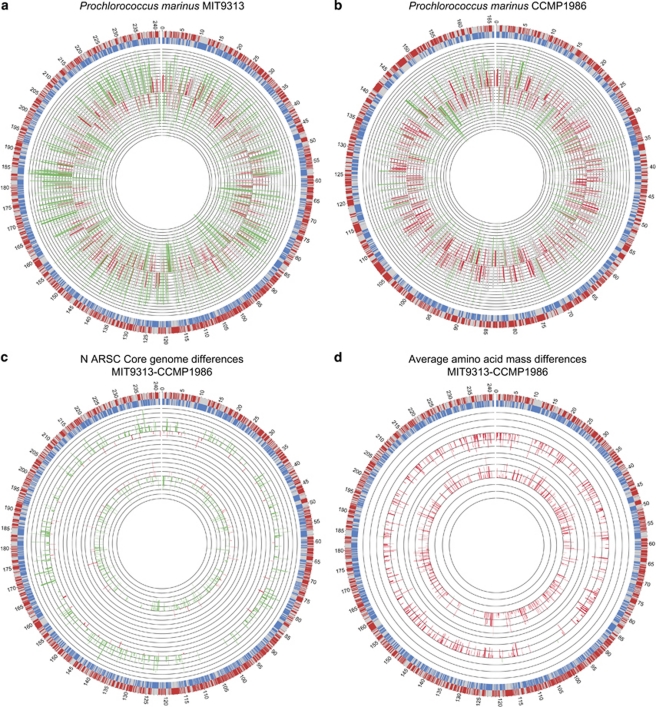
Marine microorganisms thrive under low levels of nitrogen (N). N cost minimization is a major selective pressure imprinted on open-ocean microorganism genomes. Here we show that amino-acid sequences from the open ocean are reduced in N, but increased in average mass compared with coastal-ocean microorganisms. Nutrient limitation exerts significant pressure on organisms supporting the trade-off between N cost minimization and increased average mass of amino acids that is a function of increased A+T codon usage. N cost minimization, especially of highly expressed proteins, reduces the total cellular N budget by 2.7-10%; this minimization in combination with reduction in genome size and cell size is an evolutionary adaptation to nutrient limitation. The biogeochemical and evolutionary precedent for these findings suggests that N limitation is a stronger selective force in the ocean than biosynthetic costs and is an important evolutionary strategy in resource-limited ecosystems.


Figures

Figure 1
Figure 1
Annual 10 m nitrate concentration for world oceans. Red dots are GOS sampling sites used in our analyses.
Figure 2
Figure 2
Nitrogens per amino-acid residue side chain for GOS environmental genome data. (a) Quantile plots of the average number of nitrogen ARSC for GOS stations. Red lines represent coastal-ocean sites from the GOS data set as defined in Materials and methods. Blue lines are from open-ocean sites. (b) The median N ARSC for each GOS site and one from a sewage metagenome. The color reproduction of this figure is available at the ISME Journal online.
Figure 3
Figure 3
Median nitrogen ARSC as it correlates to proximity of landmass. The correlation between the nearest land mass and median N ARSC for each GOS metagenome station. Spearman correlation coefficients are presented in Supplementary Table S1.
Figure 4
Figure 4
Circular genome plots of Prochlorococcus marinus ecotypes. (a) Coding (gray) and non-coding regions (red=leading strand, blue=lagging strand) for the P. marinus ecotype MIT 9313. Additional data are available in Supplementary Tables S4 and S5c. Averaged nitrogen ARSC for each ORF is plotted as a colored bar graph, with green indicating high nitrogen ARSC and red indicating lower as in Materials and methods. The concentric rings scale represents an increase of 0.03 N ARSC. (b) As in (a), but for the P. marinus ecotype CCMP 1986. (c) As in a, but bar graphs represent subtraction of strain MIT9313—CCMP1986 N ARSC values for all genes in the core genome (1286) excluding hypothetical proteins. Green indicates positive values and red indicates negative values. The concentric rings scale represents changes of 0.03 N ARSC. (d) Same as c except representing the average amino-acid mass difference for strain MIT9313—CCMP1986. The concentric rings scale represents changes of 3 g mol−1.

References

    1. Akashi H, Gojobori T. Metabolic efficiency and amino acid composition in the proteome of Escherichia coli and Bacillus subtilis. Proc Natl Acad Sci USA. 2002;99:3695–3700. - PMC - PubMed
    1. Barrai I, Volinia S, Scapoli C. The usage of oligopeptides in proteins correlates negatively with molecular weight. Int J Pept Prot Res. 1995;45:326–331. - PubMed
    1. Baudouin-Cornu P, Schuerer K, Marliere P, Thomas D. Intimate evolution of proteins—proteome atomic content correlates with genome base composition. J Biol Chem. 2004;279:5421–5428. - PubMed
    1. Baudouin-Cornu P, Surdin-Kerjan Y, Marliere P, Thomas D. Molecular evolution of protein atomic composition. Science. 2001;293:297–300. - PubMed
    1. Behrenfeld MJ, Worthington K, Sherrell RM, Chavez FP, Strutton P, McPhaden M, et al. Controls on tropical Pacific Ocean productivity revealed through nutrient stress diagnostics. Nature. 2006;442:1025–1028. - PubMed

Publication types