. 2012 Jan;6(1):195-212.
doi: 10.1038/ismej.2011.80. Epub 2011 Jun 23.

Analysis of bacterial core communities in the central Baltic by comparative RNA-DNA-based fingerprinting provides links to structure-function relationships

Affiliations

Analysis of bacterial core communities in the central Baltic by comparative RNA-DNA-based fingerprinting provides links to structure-function relationships

Ingrid Brettar et al. ISME J. 2012 Jan.

Abstract

Understanding structure-function links of microbial communities is a central theme of microbial ecology since its beginning. To this end, we studied the spatial variability of the bacterioplankton community structure and composition across the central Baltic Sea at four stations, which were up to 450 km apart and at a depth profile representative for the central part (Gotland Deep, 235 m). Bacterial community structure was followed by 16S ribosomal RNA (rRNA)- and 16S rRNA gene-based fingerprints using single-strand conformation polymorphism (SSCP) electrophoresis. Species composition was determined by sequence analysis of SSCP bands. High similarities of the bacterioplankton communities across several hundred kilometers were observed in the surface water using RNA- and DNA-based fingerprints. In these surface communities, the RNA- and DNA-based fingerprints resulted in very different pattern, presumably indicating large difference between the active members of the community as represented by RNA-based fingerprints and the present members represented by the DNA-based fingerprints. This large discrepancy changed gradually over depth, resulting in highly similar RNA- and DNA-based fingerprints in the anoxic part of the water column below 130 m depth. A conceivable mechanism explaining this high similarity could be the reduced oxidative stress in the anoxic zone. The stable communities on the surface and in the anoxic zone indicate the strong influence of the hydrography on the bacterioplankton community structure. Comparative analysis of RNA- and DNA-based community structure provided criteria for the identification of the core community, its key members and their links to biogeochemical functions.


Figures

Figure 1
Figure 1
Location of the four stations in the central Baltic Sea used for the assessment of the horizontal and vertical extent of the community structure of the bacterioplankton. Station G (Gotland Deep) was used for the assessment of the vertical extent with a depth profile to 225 m. Areas below 200 m are shaded gray.
Figure 2
Figure 2
Depth profiles of physical, chemical and microbiological background parameters in the Gotland Deep (station G) on 17 September 1998. (a) Temperature, salinity, oxygen and hydrogen sulfite concentrations. (b) Concentrations of the major inorganic nitrogen compounds nitrite, nitrate and ammonium. (c) Major bacterial parameters: TC, total bacterial cell counts; CFU, colony-forming units on Baltic seawater agar, and bacterial production, details are given in Materials and Methods.
Figure 3
Figure 3
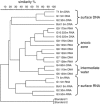
Cluster analysis of SSCP fingerprints from the different samples shown in Supplementary Figure S1. For all samples the station and sampling depth are indicated.
Figure 4
Figure 4
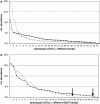
Comparison of rank-abundance curves of phylotypes from 16S rRNA (closed squares) and 16S rRNA gene (open triangles) based SSCP fingerprints from different bacterioplankton samples of the central Baltic Sea. (a) Gotland Deep (station G) 5 m, (b) 138 m (anoxic). Arrows indicate the respective detection limit of 0.1%.
Figure 5
Figure 5
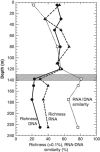
Comparison of RNA- (triangles) and DNA-based (dots) richness and the RNA to DNA similarity (open squares) calculated as described in the text from different bacterioplankton samples along depth at the Gotland Deep (station G).
Figure 6
Figure 6
Taxonomic assignments of the phylotypes (Supplementary Table S1) detected in bands excised from DNA-(D) or RNA-(R) based fingerprints or that were recovered from both DNA- and RNA-based fingerprints (D/R).
Figure 7
Figure 7
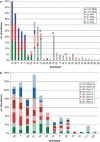
Relative abundances of the single major phylotypes in cumulative presentation sorted according to the criteria given in Tables 2 and 3. Averaged data are given in Tables 2 and 3, respectively. Full bars=DNA-based abundances, hatched bars=RNA-based abundances. (a) Surface stations G1, T1 and LL12 (Table 2); (b) anoxic samples of the Gotland Deep (station G) from G7=138, G8=150, G9=175 and G10=225 m (Table 3). Cyanobacterial phylotypes in Figure 7a are marked with a ‘C'.

References

    1. Andersson AF, Riemann L, Bertilsson S. Pyrosequencing reveals contrasting seasonal dynamics of taxa within Baltic Sea bacterioplankton communities. ISME J. 2009;4:171–181. - PubMed
    1. Asato Y. Toward an understanding of cell growth and the cell division cycle of unicellular photoautotrophic cyanobacteria. Cell Mol Life Sci (CMLS) 2003;60:663–687. - PMC - PubMed
    1. Azam F, Malfatti F. Microbial structuring of marine ecosystems. Nat Rev Microbiol. 2007;5:782–791. - PubMed
    1. Bassam BJ, Caetano-Anolles G, Gresshoff PM. Fast and sensitive silver staining of DNA in polyacrylamide gels. Anal Biochem. 1991;80:81–84. - PubMed
    1. Binder BJ, Liu YC. Growth rate regulation of RNA content of a marine Synechococcus (Cyanobacterium) strain. Appl Environ Microbiol. 1998;64:3346–3351. - PMC - PubMed

Publication types