. 2011 Jun 1;2(6):1539-52.
doi: 10.1364/BOE.2.001539. Epub 2011 May 13.

Total retinal blood flow measurement with ultrahigh speed swept source/Fourier domain OCT

Total retinal blood flow measurement with ultrahigh speed swept source/Fourier domain OCT

Bernhard Baumann et al. Biomed Opt Express. .

Abstract

Doppler OCT provides depth-resolved information on flow in biological tissues. In this article, we demonstrate ultrahigh speed swept source/Fourier domain OCT for visualization and quantitative assessment of retinal blood flow. Using swept laser technology, the system operated in the 1050-nm wavelength range at a high axial scan rate of 200 kHz. The rapid imaging speed not only enables volumetric imaging with high axial scan densities, but also enables measurement of high flow velocities in the central retinal vessels. Deep penetration in the optic nerve and lamina cribrosa was achieved by imaging at 1-µm wavelengths. By analyzing en-face images extracted from 3D Doppler data sets, absolute flow in single vessels as well as total retinal blood flow was measured using a simple and robust protocol that does not require measurement of Doppler angles. The results from measurements in healthy eyes suggest that ultrahigh speed swept source/Fourier domain OCT could be a promising technique for volumetric imaging of retinal vasculature and quantitation of retinal blood flow in a wide range of retinal diseases.

Keywords: (170.3880) Medical and biological imaging; (170.4470) Ophthalmology; (170.4500) Optical coherence tomography; (280.2490) Flow diagnostics.


Figures

Fig. 1
Fig. 1
Ultrahigh speed swept source/Fourier domain OCT instrument. (A) Light source including swept laser, buffer stage, and post amplification. Polarizer POL, isolator ISO, semiconductor optical amplifier SOA. (B) Optical output spectra of the swept laser source (left), amplified spontaneous emission from the SOA (middle), and at the output of the light source after post amplification (right). (C) OCT system. Galvanometer scanner pair GS, dichroic mirror DM, dispersion compensating glass DC, water cell WC, glass plate GP.
Fig. 2
Fig. 2
Phase artifacts in Doppler OCT images. (A) Phase shifts originating from moving scatterers, bulk motion and A-line trigger fluctuations all contribute to the detected Doppler signal. (B) In order to correct for phase artifacts and to extract the sole Doppler shift contribution from scatterers in the retina under investigation, the phase shifts at the retinal surface (green circle) as well as at a phase reference signal are detected, which is indicated by red and blue arrows and circles in the intensity and phase shift profiles, respectively. (C) Doppler B-scan images at 100 kHz before (top) and after phase correction (bottom). The white line indicates the position of the axial scan shown in (B).
Fig. 3
Fig. 3
Scheme of Doppler OCT flow measurements. (A) In conventional Doppler methods, the angle α between the vessel is measured to compute absolute velocity values vabs. By measuring the cross-sectional area of the vessel, total flow can be calculated. (B) En-face plane based flow method. Total flow is calculated by integrating the axial velocity components vz in a surface S whose normal vector is parallel to vz.
Fig. 4
Fig. 4
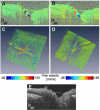
Volumetric Doppler OCT imaging of retinal vasculature. (A) Doppler OCT B-scan image at 100 kHz close to the optic disk. (B) Corresponding Doppler OCT image at 200kHz. Arterial and venous vessels in the papilla can be distinguished in red and blue color. Note that the color scale encodes the ranges of ±19.7 mm/s and ±39.5 mm/s for 100 kHz and 200 kHz, respectively. 3D renderings of volumetric data sets at 100 kHz (C, Media 1) and 200 kHz (D, Media 2) show the three-dimensional structure of the retinal arteries and veins branching in the optic disk. (E) Structural reflectivity B-scan image demonstrating the robustness of the swept-source/Fourier domain OCT system to signal loss due to interference fringe washout.
Fig. 5
Fig. 5
Absolute blood flow measurement at different depths in the optic disk. (A) Doppler B-scan image. The depth range over which en-face flow measurements were performed (Media 3) is indicated; the dashed line shows the location of image (B). (B) En-face Doppler image. Cross sections of central retinal arteries labeled A1–A3 and veins (V) can be observed. (C) Blood flow measured at different depths in A1–A3 and total arterial blood flow computed by summing the flow values for individual retinal arteries (A1 + A2 + A3) as well as by integrating blood flow towards the OCT beam in a large area covering all vessels. (D) Relationship between total vessel area in the en-face plane and mean axial flow velocity. Each magenta and cyan circle indicates one depth-resolved flow measurement for evaluating the large area and for summing the individual vessel measurements, respectively. The expected relations assuming the average flow are plotted as dash-dotted lines for the respective measurements.
Fig. 6
Fig. 6
Pulsatility measurement using ultrahigh speed Doppler OCT. (A) Measurement of pulsatile axial flow velocity in two central arterial branches close to the optic nerve head over 5 seconds. Details of Doppler OCT B-scan images show cross sections of two arterial and one venous branch vessel at different phases of the pulse. (B) The locations of pulsatile flow measurements in 4 branch arteries around the optic disk are indicated by the crosses on the fundus photo. (C) Quantitative pulsatility assessment. For the vessels numbered 1–4 in (B), maximum and minimum velocities are plotted as black and white triangles for 5 pulse cycles.

References

    1. Flammer J., Orgül S., Costa V. P., Orzalesi N., Krieglstein G. K., Serra L. M., Renard J. P., Stefánsson E., “The impact of ocular blood flow in glaucoma,” Prog. Retin. Eye Res. 21(4), 359–393 (2002).10.1016/S1350-9462(02)00008-3 - DOI - PubMed
    1. Schmetterer L., Wolzt M., “Ocular blood flow and associated functional deviations in diabetic retinopathy,” Diabetologia 42(4), 387–405 (1999).10.1007/s001250051171 - DOI - PubMed
    1. Friedman E., “A hemodynamic model of the pathogenesis of age-related macular degeneration,” Am. J. Ophthalmol. 124(5), 677–682 (1997). - PubMed
    1. Schmetterer L., Garhofer G., “How can blood flow be measured?” Surv. Ophthalmol. 52(6 Suppl 2), S134–S138 (2007).10.1016/j.survophthal.2007.08.008 - DOI - PubMed
    1. Lieb W. E., Cohen S. M., Merton D. A., Shields J. A., Mitchell D. G., Goldberg B. B., “Color Doppler imaging of the eye and orbit. Technique and normal vascular anatomy,” Arch. Ophthalmol. 109(4), 527–531 (1991). - PubMed

LinkOut - more resources