. 2011;6(6):e20914.
doi: 10.1371/journal.pone.0020914. Epub 2011 Jun 17.

Energy metabolism in human pluripotent stem cells and their differentiated counterparts

Affiliations

Energy metabolism in human pluripotent stem cells and their differentiated counterparts

Sandra Varum et al. PLoS One. 2011.

Abstract

Background: Human pluripotent stem cells have the ability to generate all cell types present in the adult organism, therefore harboring great potential for the in vitro study of differentiation and for the development of cell-based therapies. Nonetheless their use may prove challenging as incomplete differentiation of these cells might lead to tumoregenicity. Interestingly, many cancer types have been reported to display metabolic modifications with features that might be similar to stem cells. Understanding the metabolic properties of human pluripotent stem cells when compared to their differentiated counterparts can thus be of crucial importance. Furthermore recent data has stressed distinct features of different human pluripotent cells lines, namely when comparing embryo-derived human embryonic stem cells (hESCs) and induced pluripotent stem cells (IPSCs) reprogrammed from somatic cells.

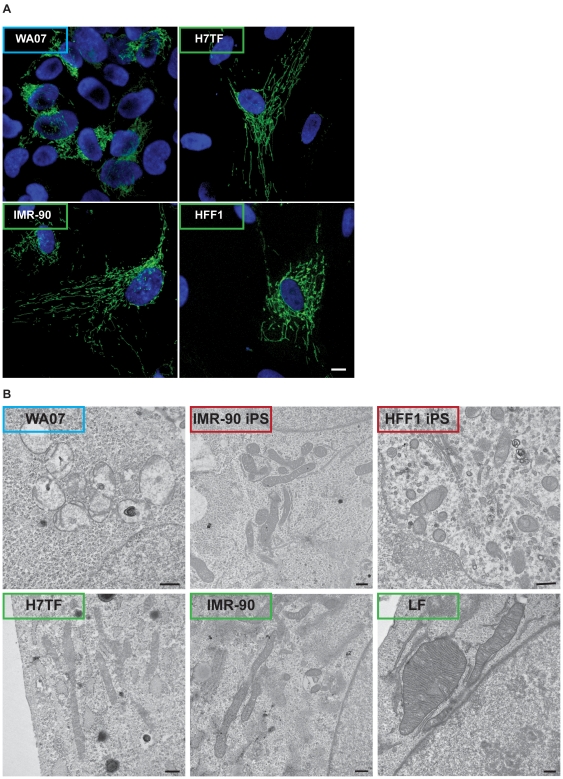
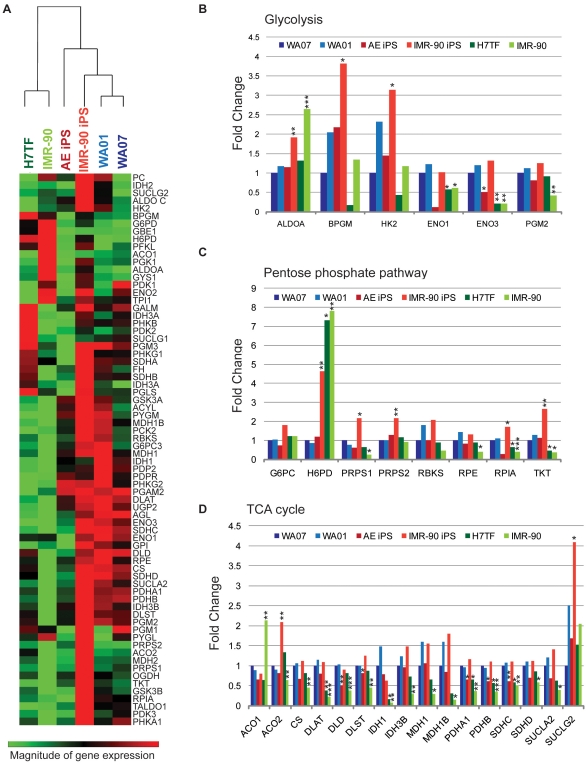
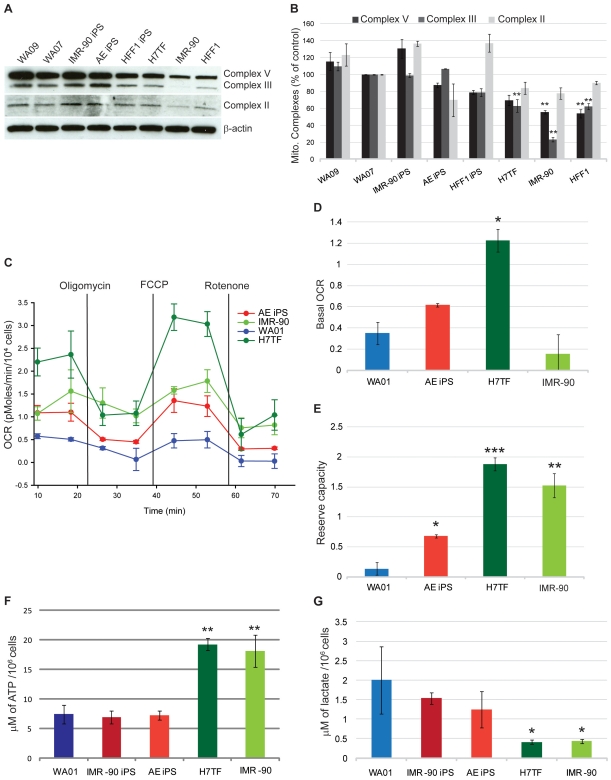
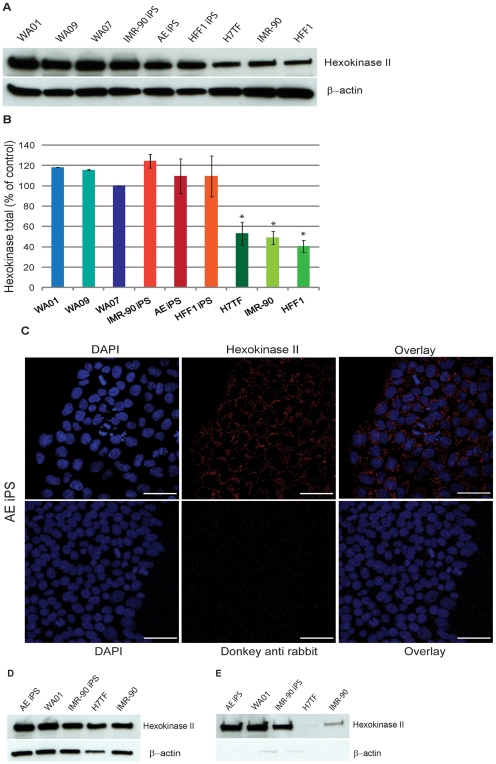
Methodology/principal findings: We compared the energy metabolism of hESCs, IPSCs, and their somatic counterparts. Focusing on mitochondria, we tracked organelle localization and morphology. Furthermore we performed gene expression analysis of several pathways related to the glucose metabolism, including glycolysis, the pentose phosphate pathway and the tricarboxylic acid (TCA) cycle. In addition we determined oxygen consumption rates (OCR) using a metabolic extracellular flux analyzer, as well as total intracellular ATP levels by high performance liquid chromatography (HPLC). Finally we explored the expression of key proteins involved in the regulation of glucose metabolism.

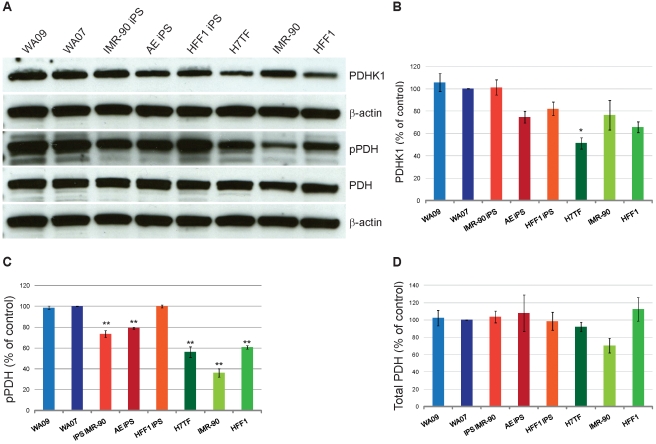
Conclusions/findings: Our results demonstrate that, although the metabolic signature of IPSCs is not identical to that of hESCs, nonetheless they cluster with hESCs rather than with their somatic counterparts. ATP levels, lactate production and OCR revealed that human pluripotent cells rely mostly on glycolysis to meet their energy demands. Furthermore, our work points to some of the strategies which human pluripotent stem cells may use to maintain high glycolytic rates, such as high levels of hexokinase II and inactive pyruvate dehydrogenase (PDH).


Conflict of interest statement

Competing Interests: The authors have declared that no competing interests exist.

Figures

Figure 1
Figure 1. Mitochondrial morphology and localization in human pluripotent stem cells vs. differentiated cells.
A) Transduction of hESCs (WA07 line,) and differentiated cells (H7TF, HFF, and IMR-90 lines) with organelle lights MitoGFP was used investigate mitochondria morphology and localization within the cell. Blue: DAPI; Green: pyruvate dehydrogenase GFP. Scale bar: 10 µm B) Transmission electron microscopy (TEM) was used to investigate mitochondria morphologic features in hESCs (WA07 line), IPSCs (HFF1 and IMR-90 IPSC lines), and fibroblasts cells (H7TF, IMR-90 and HFF1). Scale bar: 500 nm.
Figure 2
Figure 2. Metabolism-related gene expression in human pluripotent stem cells vs. differentiated cells.
A) Heat map of average gene expression. Gene expression is represented as log10 of Ct values. An increase in gene expression is depicted in red, whereas a decrease in gene expression is represented by the green color. No differences in expression are depicted in black. Clustering was performed using SABiosciences online software. The various genes were grouped accordingly to their participation in different metabolic pathways. B) Glycolysis-related genes with at least two fold difference when compared to the WA07 line. C) Pentose phosphate pathways-related genes with at least two fold differences when compared to the WA07 line. D) TCA cycle- related genes with at least two fold differences when compared to the WA07 line. Fold changes were calculated using the -ΔΔCt method relative to the WA07 line. hESC lines are represented in blue, IPSC lines in red and somatic cell lines in green . The values represent means of three independent experiments. Statistical analysis was performed using Student's t test (SABiosciences online software) and significance was determined at p<0.05. Statistically significant differences are represented in Table 1.
Figure 3
Figure 3. Mitochondrial contribution to the energetic metabolism of human pluripotent stem cells and differentiated cells.
A) Western blotting analysis of mitochondrial complexes II, III and V. β-actin was used as a loading control. B) Quantification of mitochondrial complexes II, III and V protein levels relative to the WA07 line. C) Oxygen consumption rate (OCR) was determined by Seahorse XF24 analyzer. The three mitochondrial inhibitors were sequentially injected (after measurement points, 2, 4, and 6, as indicated) and the final concentrations of each were: oligomycin (1 µM); FCCP (300mM); rotenone (1 µM) D) Basal OCR (represents the mean of the first two measurements minus the mean of measurements 3 & 4). E) Reserve capacity (FCCP induced levels, measurements 5 & 6 minus the basal level). F) Intracellular ATP levels determined by HPLC. G) Lactate levels secreted to the media. The values are averages of three independent experiments. Statistical significance was determined by one-way ANOVA followed by Dunnet's multiple comparison test. Statistical significance was determined at P<0.05. Error bars: SEM.
Figure 4
Figure 4. Hexokinase II expression in human pluripotent stem cells and differentiated cells.
A) Western blotting analysis for hexokinase II protein levels. B) Quantification of Hexokinase II protein levels relative to the WA07 line. CE) Hexokinase II protein levels in the cytoplasmic and mitochondrial fractions, respectively. β-actin was used as a loading control. Values are means of three independent experiments. Statistical significance was determined at p<0.05 by one-way ANOVA followed by Dunnet's multiple comparison test. Error bars: SEM
Figure 5
Figure 5. Pyruvate dehydrogenase regulation in human pluripotent stem cells and differentiated cells.
A) Western blotting analysis of PDHK1, pPDH and total PDH protein levels. β-actin was used as a loading control. BD) Protein levels quantification relative to the Wa07 line of PDHK1, pPDH and PDH, respectively. Values are means of three independent experiments. Statistical significance was determined at p<0.05 by one-way ANOVA followed by Dunnet's multiple comparison test. Error bars: SEM Abbreviations: PDHK1, pyruvate dehydrogenase kinase one; pPDH: phospho Ser 293 pyruvate dehydrogenase subunit E1α; PDH: pyruvate dehydrogenase.

References

    1. Yu J, Vodyanik MA, Smuga-Otto K, Antosiewicz-Bourget J, Frane JL, et al. Induced pluripotent stem cell lines derived from human somatic cells. Science. 2007;318:1917–1920. - PubMed
    1. Takahashi K, Yamanaka S. Induction of pluripotent stem cells from mouse embryonic and adult fibroblast cultures by defined factors. Cell. 2006;126:663–676. - PubMed
    1. Takahashi K, Tanabe K, Ohnuki M, Narita M, Ichisaka T, et al. Induction of pluripotent stem cells from adult human fibroblasts by defined factors. Cell. 2007;131:861–872. - PubMed
    1. Chin MH, Mason MJ, Xie W, Volinia S, Singer M, et al. Induced pluripotent stem cells and embryonic stem cells are distinguished by gene expression signatures. Cell Stem Cell. 2009;5:111–123. - PMC - PubMed
    1. Maherali N, Sridharan R, Xie W, Utikal J, Eminli S, et al. Directly reprogrammed fibroblasts show global epigenetic remodeling and widespread tissue contribution. Cell Stem Cell. 2007;1:55–70. - PubMed

Publication types