. 2011;6(6):e20321.
doi: 10.1371/journal.pone.0020321. Epub 2011 Jun 17.

Variation in human recombination rates and its genetic determinants

Affiliations

Variation in human recombination rates and its genetic determinants

Adi Fledel-Alon et al. PLoS One. 2011.

Abstract

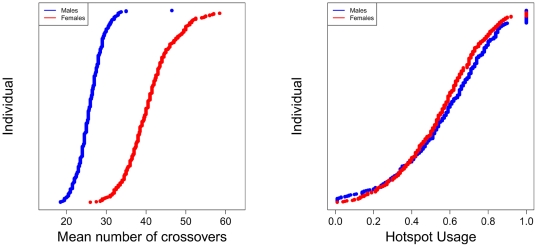
Background: Despite the fundamental role of crossing-over in the pairing and segregation of chromosomes during human meiosis, the rates and placements of events vary markedly among individuals. Characterizing this variation and identifying its determinants are essential steps in our understanding of the human recombination process and its evolution.

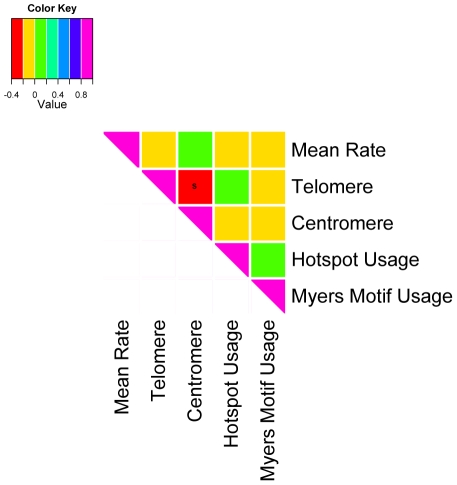
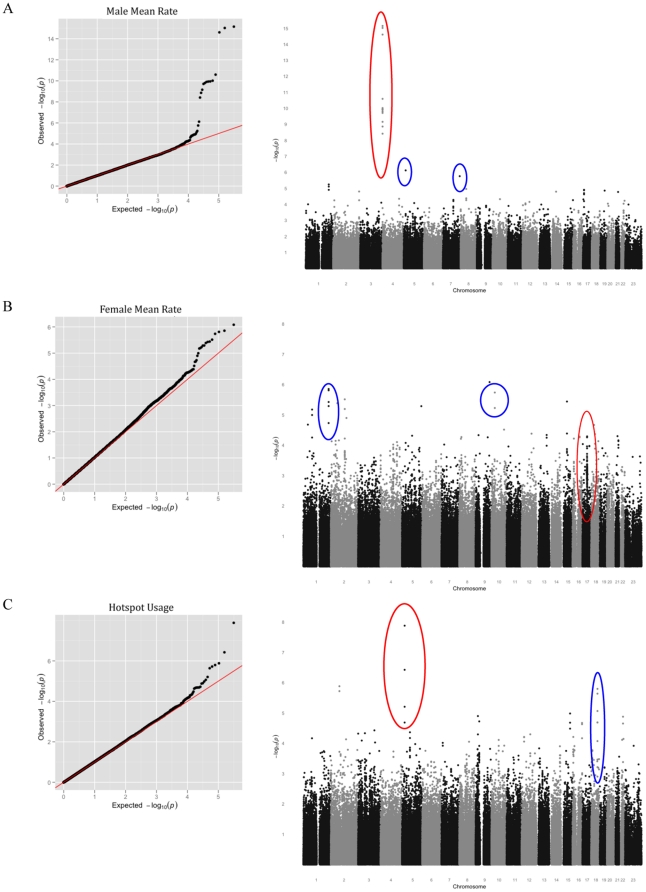
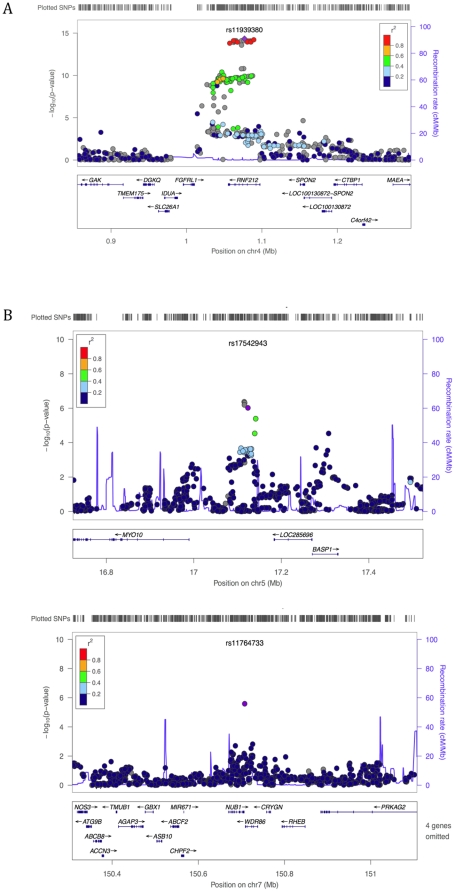
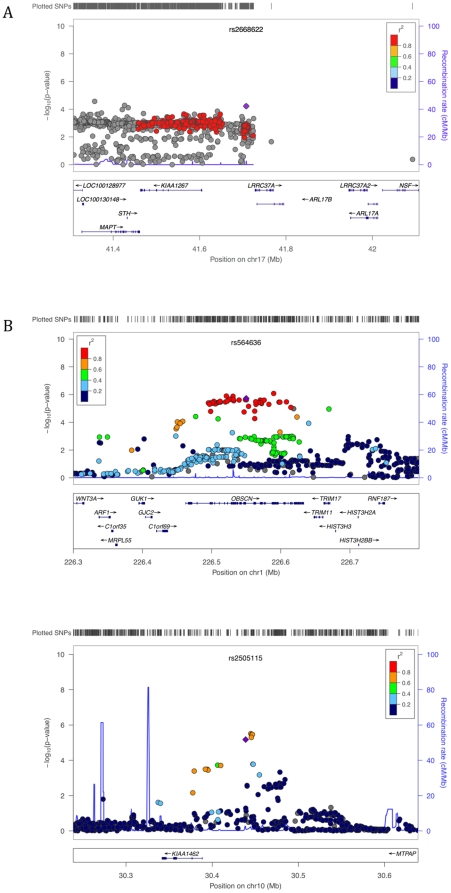
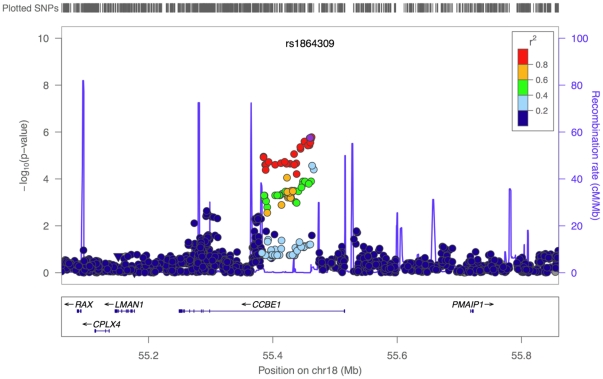
Study design/results: Using three large sets of European-American pedigrees, we examined variation in five recombination phenotypes that capture distinct aspects of crossing-over patterns. We found that the mean recombination rate in males and females and the historical hotspot usage are significantly heritable and are uncorrelated with one another. We then conducted a genome-wide association study in order to identify loci that influence them. We replicated associations of RNF212 with the mean rate in males and in females as well as the association of Inversion 17q21.31 with the female mean rate. We also replicated the association of PRDM9 with historical hotspot usage, finding that it explains most of the genetic variance in this phenotype. In addition, we identified a set of new candidate regions for further validation.

Significance: These findings suggest that variation at broad and fine scales is largely separable and that, beyond three known loci, there is no evidence for common variation with large effects on recombination phenotypes.


Conflict of interest statement

Competing Interests: The authors have declared that no competing interests exist.

Figures

Figure 1
Figure 1. Variation in mean recombination rate and historical hotspot usage in the AGRE. Individuals are ordered within sex by their estimated phenotype, with males in blue and females in red.
Figure 2
Figure 2. Correlation among the five recombination phenotypes in the AGRE.
The strength of the correlation coefficient is color-coded; «s» indicates significance at the 5% level. Other than a negative correlation between telomere and centromere usage (p = 1.97×10⁻⁹), the five phenotypes are not significantly correlated with one another.
Figure 3
Figure 3. Results of the meta-analysis of FHS and AGRE for three recombination phenotypes.
Each row consists of a Q-Q plot of observed against expected p-values (left panel) and a Manhattan plot showing the observed p-values across the genome (right panel). A. For the male mean rate. In the Manhattan plot, SNPs at RNF212 are circled in red and new candidate associations discussed in the main text are circled in blue. B. For the female mean rate. In the Manhattan plot, SNPs at or near Inversion 17q21.3 are circled in red and new candidate associations discussed in the main text are circled in blue. C. For the historical hotspot usage in the two sexes. SNPs near PRDM9 are circled in red and a new candidate association discussed in the text is circled in blue.
Figure 4
Figure 4. A close up of the association signal at previously reported and new candidate regions for male mean recombination rate.
The figures show the p-values across the candidate regions for the genotyped and imputed SNPs plotted using the LocusZoom software (only SNPs with an rs numbers are shown, but plots using all SNPs were qualitatively similar). The 1000 Genomes Project data was used for the imputation in all LocusZoom figures, with the exception of Figure 4A for which HapMap data were used (as in this region LD patterns in the 1000 Genomes data were inconsistent with those from HapMap and the AGRE and FHS samples). The imputation-based approach uses a different test statistic than we employed in our analysis , so p-values can differ slightly from those reported in the main text. The focal SNP (with the lowest p-value) is plotted as a purple diamond; other data points are colored according to their r2 with the focal SNP; SNPs with missing linkage disequilibrium information are shown in grey. A. Association of male mean recombination rate with SNPs in RNF212. B. Top associations for male mean recombination rate.
Figure 5
Figure 5. A close up of the association signal at previously reported and new candidate regions for female mean recombination rate.
The figures were generated using the software LocusZoom , as described in the legend of Figure 4. A. Replication of association signal for female mean recombination rate near inversion 17q21.13. B. Top associations for female mean recombination rate.
Figure 6
Figure 6. A close up of the association signal at a new candidate region for hotspot usage.
The plot was generated using the software LocusZoom , as described in the legend of Figure 4.

References

    1. Hassold T, Hunt P. To err (meiotically) is human: the genesis of human aneuploidy. Nat Rev Genet. 2001;2:280–291. - PubMed
    1. Sturtevant AH. The behavior of the chromosome as studied through linkage. Molecular and General Genetics MGG. 1915;13:234–287.
    1. Muller HJ. The mechanism of crossing-over. American Naturalist. 1916;50:421–434.
    1. Broman KW, Murray JC, Sheffield VC, White RL, Weber JL. Comprehensive human genetic maps: individual and sex-specific variation in recombination. Am J Hum Genet. 1998;63:861–869. - PMC - PubMed
    1. Lenzi ML, Smith J, Snowden T, Kim M, Fishel R, et al. Extreme heterogeneity in the molecular events leading to the establishment of chiasmata during meiosis i in human oocytes. Am J Hum Genet. 2005;76:112–127. - PMC - PubMed

Publication types