. 2011;6(6):e20769.
doi: 10.1371/journal.pone.0020769. Epub 2011 Jun 17.

Impact of cellular miRNAs on circulating miRNA biomarker signatures

Affiliations

Impact of cellular miRNAs on circulating miRNA biomarker signatures

Radha Duttagupta et al. PLoS One. 2011.

Abstract

Effective diagnosis and surveillance of complex multi-factorial disorders such as cancer can be improved by screening of easily accessible biomarkers. Highly stable cell free Circulating Nucleic Acids (CNA) present as both RNA and DNA species have been discovered in the blood and plasma of humans. Correlations between tumor-associated genomic/epigenetic/transcriptional changes and alterations in CNA levels are strong predictors of the utility of this biomarker class as promising clinical indicators. Towards this goal microRNAs (miRNAs) representing a class of naturally occurring small non-coding RNAs of 19-25 nt in length have emerged as an important set of markers that can associate their specific expression profiles with cancer development. In this study we investigate some of the pre-analytic considerations for isolating plasma fractions for the study of miRNA biomarkers. We find that measurement of circulating miRNA levels are frequently confounded by varying levels of cellular miRNAs of different hematopoietic origins. In order to assess the relative proportions of this cell-derived class, we have fractionated whole blood into plasma and its ensuing sub-fractions. Cellular miRNA signatures in cohorts of normal individuals are catalogued and the abundance and gender specific expression of bona fide circulating markers explored after calibrating the signal for this interfering class. A map of differentially expressed profiles is presented and the intrinsic variability of circulating miRNA species investigated in subsets of healthy males and females.


Conflict of interest statement

Competing Interests: The authors have read the journal's policy and have the following conflicts: the authors RD, RJ, JG and KWJ are employees of Affymetrix. Inc. RCG is an employee of Genisphere, LLC. This does not alter the authors' adherence to all the PLoS ONE policies on sharing data and materials.

Figures

Figure 1
Figure 1. Fractionation Workflow.
Separation of whole blood into distinct fractions: WBC, RBC, Leukocytes and CS, S1, S2, P1, P2 through differential centrifugation. Total RNA was extracted from each fraction and hybridized to miRNA arrays.
Figure 2
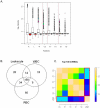
Figure 2. Profiling of blood derived fractions and correlation of miRNA intensities between individual fractions and contaminant class.
(A) Box plots representing background subtracted non-normalized and summarized log2 intensities of human miRNAs (white) and background probes (red) from each fraction. The black bar represents the median of each distribution. The open circles represent the outliers. (B) Counts of detected features in Leukocytes (L), WBC (W) and RBC (R) constituting the contaminant profile. (C) Heat map of Spearman's Rank Correlation coefficients of the highest expressing 100 miRNAs across all 5 plasma fractions (CS, S1, S2, P1 and P2). The contaminant class is designated as LWR and represents 313 miRNAs derived from the union of the Leukocytes, WBC and RBC fractions. Correlation values are shown in the bar scale.
Figure 3
Figure 3. Concordance of expression levels of circulating miRNA species between the CS, S1 and P1 fractions.
(A–D) Heat map of Spearman's Rank Correlation coefficients for the highest expressing 20, 35, 50 and 100 miRNAs present in CS, P1 and S1 fractions after removal of contaminant features. The correlation values are shown in the bar scale.
Figure 4
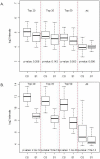
Figure 4. Comparison of expression levels of circulating and cellular miRNAs in the CS and S1 fractions.
(A) Intensity distributions from the highest expressed 20, 35, 50 or all 534 human miRNAs in the CS and S1 fractions after removal of contaminant features. P-values from paired Student's t-tests, contrasting the intensities for each pair of conditions are reported. (B) Intensity distributions from the highest expressed 20, 35, 50 or all 313 contaminant miRNAs in the CS and S1 fractions with p-values from paired t-tests measuring significance.
Figure 5
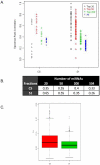
Figure 5. Correlation of expression levels of circulating miRNAs across different biological replicates in the CS and S1 fractions.
(A) Spearman's Rank Correlation coefficients for CS and S1 fractions, across all replicates restricting to the highest expressing 20, 50, 200 or 534 (all) human miRNAs that are common to the 2 fractions. Each point on the graph represents the rank correlation values across all pair-wise combination of replicates for the category under study. (B) Mean correlation values for the CS and S1 fraction in each intensity strata. (C) Analysis of Coefficient of Variance of the CS and S1 fractions for the 534 miRNAs under study.
Figure 6
Figure 6. Variability of circulating miRNA expression levels in normal cohorts of male and female individuals.
(A) Box plot of intensity distributions of 140 features common to both circulation and in contaminants (+S/+L) or 47 features specific only to circulation (+S/−L). The black bar represents the median of each distribution. The open circles represent the outliers. (B) Analysis of Coefficient of Variance of these two categories. P-value from two-sided Student's t-test measuring tests of significance is reported.
Figure 7
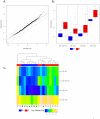
Figure 7. Analysis of differentially expressed miRNA species present in gender specific categories.
(A) Comparison of observed versus the expected scores obtained by SAM analysis of all 534 features from 8 males and 10 Caucasian females. Each feature is represented by an open circle, and the differentially expressed features represented as red points in the graph. The dashed lines represent a FDR threshold of 5%. (B) Distributions of normalized log2 signal intensities of 4 differentially expressed features in males (M1–M8; blue) and females (F1–F10; red). (C) Hierarchical clustering of samples (males in blue: M1–M8 and females in red: F1–F10) based on summarized intensity values from the 4 differentially expressed circulating miRNAs. The log2 intensity values are shown in the bar scale.

References

    1. Fleischhacker M, Schmidt B. Circulating nucleic acids (CNAs) and cancer–a survey. Biochim Biophys Acta. 2007;1775:181–232. - PubMed
    1. van der Vaart M, Pretorius PJ. The origin of circulating free DNA. Clin Chem. 2007;53:2215. - PubMed
    1. John B, Enright AJ, Aravin A, Tuschl T, Sander C, et al. Human MicroRNA targets. PLoS Biol. 2004;2:e363. - PMC - PubMed
    1. Griffiths-Jones S. The microRNA Registry. Nucleic Acids Res. 2004;32:D109–111. - PMC - PubMed
    1. Griffiths-Jones S, Grocock RJ, van Dongen S, Bateman A, Enright AJ. miRBase: microRNA sequences, targets and gene nomenclature. Nucleic Acids Res. 2006;34:D140–144. - PMC - PubMed

Publication types