. 2011 Jun;7(6):e1002068.
doi: 10.1371/journal.pcbi.1002068. Epub 2011 Jun 16.

Mutation D816V alters the internal structure and dynamics of c-KIT receptor cytoplasmic region: implications for dimerization and activation mechanisms

Affiliations

Mutation D816V alters the internal structure and dynamics of c-KIT receptor cytoplasmic region: implications for dimerization and activation mechanisms

Elodie Laine et al. PLoS Comput Biol. 2011 Jun.

Abstract

The type III receptor tyrosine kinase (RTK) KIT plays a crucial role in the transmission of cellular signals through phosphorylation events that are associated with a switching of the protein conformation between inactive and active states. D816V KIT mutation is associated with various pathologies including mastocytosis and cancers. D816V-mutated KIT is constitutively active, and resistant to treatment with the anti-cancer drug Imatinib. To elucidate the activating molecular mechanism of this mutation, we applied a multi-approach procedure combining molecular dynamics (MD) simulations, normal modes analysis (NMA) and binding site prediction. Multiple 50-ns MD simulations of wild-type KIT and its mutant D816V were recorded using the inactive auto-inhibited structure of the protein, characteristic of type III RTKs. Computed free energy differences enabled us to quantify the impact of D816V on protein stability in the inactive state. We evidenced a local structural alteration of the activation loop (A-loop) upon mutation, and a long-range structural re-organization of the juxta-membrane region (JMR) followed by a weakening of the interaction network with the kinase domain. A thorough normal mode analysis of several MD conformations led to a plausible molecular rationale to propose that JMR is able to depart its auto-inhibitory position more easily in the mutant than in wild-type KIT and is thus able to promote kinase mutant dimerization without the need for extra-cellular ligand binding. Pocket detection at the surface of NMA-displaced conformations finally revealed that detachment of JMR from the kinase domain in the mutant was sufficient to open an access to the catalytic and substrate binding sites.


Conflict of interest statement

The authors have declared that no competing interests exist.

Figures

Figure 1
Figure 1. Structure of KIT cytoplasmic region in the inactive (auto-inhibited) and active states.
Top: Cartoon representation of wild-type KIT crystallographic structures: (a) inactive (auto-inhibited) state (PDB code 1T45) and (b) active state (PDB code 1PKG). The different domains composing the cytoplasmic region and key structural elements are labeled and highlighted in color. The N-terminal proximal lobe (N-lobe) is in green, the C-terminal distal lobe (C-lobe) is in blue and in-between the kinase insert domain (KID) is in grey. The segments JM-Proximal (JM-P, in purple), JM-Buried (JM-B, in pink), JM-Switch (JM-S, in light orange) and JM-Zipper (JM-Z, in orange) composing the juxta-membrane region (JMR) are specified. The activation loop (A-loop) is in red - its DFG motif highlighted in licorice with white carbons, the C-helix is in lime and the glycine-rich P-loop is in yellow. F-helix (HF) in the C-lobe is labeled in white. The position of the catalytic site is indicated in the active structure (b), where the bound ligand ADP is drawn with licorice and the Mg2+ ion is represented by a magenta sphere. The locations of mutational hot spot residues are indicated by spheres depicting the positions of their Cα atoms, with the D816V mutation highlighted in black. Bottom: Schematic diagrams of the predicted secondary structure elements and interaction networks of JMR and A-loop: (c) inactive (auto-inhibited) state (1T45) and (d) active state (1PKG). JMR is in orange, N-lobe including C-helix (denoted Cα) is in green, C-lobe is in blue and A-loop is in red. Stabilizing H-bonds are drawn as dashed purple lines and the participating residues are labeled. Curved dashed purple lines represent turns. Phosphorylation sites Y568, Y570 and Y823 are highlighted. Encircled residues indicate mutational hot spots.
Figure 2
Figure 2. MD simulations of KIT cytoplasmic region in the auto-inhibited inactive form.
The RMS deviations (in Å) were calculated from MD simulations of full-length CR for wild-type KIT, WT547-935 (in blue), and D816V mutant, MU547-935 (in red), on the backbone atoms of (a) the whole CR, (b) N-lobe, (c) C-lobe, (d) A-loop and (e) JMR. The 50-ns simulations 1 and 2 of the wild-type (mutant, respectively) are shown by plain and dashed lines. The dashed grey vertical line drawn at 2 ns indicates the relaxation time.
Figure 3
Figure 3. Protein stability and binding free energy changes between wild-type and D816V-mutated KIT in the inactive state.
(a) Protein stability changes between wild-type and D816V-mutated KIT full-length CR: the table on the left gives the energetical contributions (in kcal/mol) computed on simulations 1 and 2 of full-length CR for wild-type (WT547-935) and mutant (MU547-935); the barplot on the right gives enthalpic (ΔH, in black), entropic (ΔTS, in dark grey) and total energy (ΔG, in light grey) changes computed from simulation 2 of WT547-935 and simulation 1 of MU547-935 (values in bold in the table). Statistical errors are given in parentheses in the table and represented as bars on the barplot. (b) Binding free energy changes of JMR and its fragments to KIT PTK between wild-type and mutant: the diagram on top represents a thermodynamic cycle picturing the dissociation of JMR from wild-type and mutated PTK; the table at the bottom gives the enthalpy (ΔΔH = ΔΔGgas+ΔΔGgb+ΔΔGsa), the entropy (ΔΔTS) and the total free energy (ΔΔG) differences (in kcal/mol), computed on the equilibrated conformations of WT547-935 and MU547-935. The different energetical contributions are defined in the Materials and Methods section.
Figure 4
Figure 4. MD conformations and secondary structure of wild-type and D816V-mutated KIT cytoplasmic region in the inactive state.
(a) MD conformations were taken at 14, 26, 38 and 50 ns from the two 50-ns MD simulations of wild-type KIT, WT547-935 (upper panel) and D816V mutant, MU547-935 (lower panel) and were superimposed by pair in cartoon representation. JMR is in orange (WT) and yellow (MU), N-lobe is in green (WT) and lime (MU), A-loop is in red (WT) and magenta (MU), and C-lobe is in marine (WT) and cyan (MU). (b) Secondary structure assignments for JMR (on the left) and A-loop (on the right) were averaged over the two 50-ns MD simulations of wild-type KIT, WT547-935 (at the top) and D816V mutant, MU547-935 (at the bottom). For each residue, the proportion of every secondary structure type is given as a percentage of the 96-ns total productive simulation time. 310 helix is colored in red, parallel β-sheet in light blue, anti-parallel β-sheet in dark blue, turn in green and the cumulative sum in gray. The 816 position is indicated by a big point in magenta.
Figure 5
Figure 5. Interaction networks between JMR and PTK in auto-inhibited inactive KIT.
Upper Panel: the wild-type, WT547-935. Lower Panel: the mutant, MU547-935. MD conformations averaged over the simulations 1 and 2 of WT547-935 and MU547-935 are represented as grey ribbons. Residues establishing at least one H-bond (a) or hydrophobic contact (b) between JMR and PTK for at least 15% of the total 96 ns productive simulation time are highlighted with colored transparent spheres. The color code, specified by the color scale bar on the right, goes from dark blue through green to red with increasing occupancy (in percentage of the simulation time). Ellipsoids drawn on Cα positions represent the anisotropic atomic fluctuations, computed after RMS fit onto the average MD conformation.
Figure 6
Figure 6. Principal component analysis of KIT cytoplasmic region motions in the auto-inhibited inactive form.
The calculation was performed on the backbone atoms of WT547-935 and MU547-935, combining the MD trajectories 1 and 2 (total of 96-ns productive simulation time) and taking the average MD conformations as references for the RMS fits. Top: (a) The barplot gives the eigenvalues spectra of wild-type (in blue) and mutant (in red), in descending order. (b) The grid gives the overlaps between eigenvectors from wild-type (columns) and mutant (rows). The overlap or similarity between two eigenvectors is evaluated as their scalar product and represented by a colored rectangle, from blue (−0.7) though green (0) to red (0.7). Bottom: (c) Modes 2 atomic components for wild-type (left panel) and mutant (right panel) are drawn as dark grey arrows on the protein cartoon representation. JMR is in orange (WT) and yellow (MU), N-lobe is in green (WT) and lime (MU), A-loop is in red (WT) and magenta (MU), C-lobe is in marine (WT) and cyan (MU).
Figure 7
Figure 7. Normal modes illustrating atomic motions accessible to JMR in KIT auto-inhibited inactive form.
Upper Panel : the wild-type, WT547-935. Lower Panel : the mutant, MU547-935. Each mode is labeled and the MD conformation from which it was obtained is given. The two extreme conformations along each mode in each direction are displayed in cartoon representation, in opaque cyan (JMR in blue) and transparent red (JMR in purple). The atomic (Cα) components of each mode are drawn as red arrows.
Figure 8
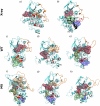
Figure 8. Pockets detected on the surface of wild-type and D816V-mutated KIT cytoplasmic region.
Upper Panel: X-ray structures of KIT (a) in the inactive (auto-inhibited) form (1T45) and (b) in the active form (1PKG, chain A). Middle Panel: Conformations obtained from the 4-Å displacement of wild-type KIT along normal modes (d) 18{42356-ps}, (c) 29{34238-ps} and (e) 21{49260-ps}. Lower Panel: Conformations obtained from the 4-Å displacement of D816V mutant along normal modes (f) 7{30180-ps}, (g) 16{30180-ps} and (h) 17{2531-ps}. The core of the protein is in cyan, JMR is in orange, A-loop is in red and G-helix, which serves as a platform for the substrate in 1PKG, in labeled in black. The substrate is displayed in black cartoon and licorice on 1PKG structure (b). Residues involved in H-bonds between JMR and the PTK are drawn with sticks and the H-bonds are indicated by dashed purple lines. Pockets are displayed in red when they overlap with the catalytic site, in orange when they are located between the catalytic site and JMR, in olive, green or purple when they overlap with the substrate binding site.
Figure 9
Figure 9. Schematic representation of a proposed model for wild-type and D816-mutated KIT dimerization and activation processes.
(a) In wild-type KIT, the activation process supposedly unfolds as follows: (1) the receptor is anchored at the cell membrane in form of a monomer (PDB code 3EC8), (2) the density increases, but a minimal distance of 60 Å is kept between monomers due to electrostatic repulsion between domains D4 (mechanism proposed in [15]), (3) binding of SCF dimeric ligand promotes dimerization of KIT ectodomain and induces a conformational twist that brings the domains D5 of the two monomers in contact, (4) transmembrane helices of the two monomers are as close as 15 Å to each other, permitting dimerization sans transphosphorylation of KIT cytoplasmic region. (b) The D816V mutant is activated and triggers signaling pathways when anchored to the Endoplasmic Reticulum (ER) membrane, so that it does not meet the extra-cellular SCF ligand (mechanism proposed in [43]). Electrostatic repulsion between domains D4 of KIT monomers still holds, preventing dimerization and conformational twist of the ectodomain. However, our results show that JMR is allowed more freedom of movement and can spontaneously extend from PTK. Based on our NMA-displaced conformations, we can evaluate at about 20 Å at least the increase in the longest dimension of the protein. This increase could be sufficient to overcome the gap imposed by D4-D4 electrostatic repulsion and promote spontaneous dimerization of KIT cytoplasmic region, explaining why the D816V mutant functions as a dimer. The model of mutant dimer was drawn based on the lowest-energy complex predicted by RosettaDock (communicated in [115]) using KIT 4-Å conformation displaced along normal mode 17{2531-ps}.

References

    1. Olsen JV, Blagoev B, Gnad F, Macek B, Kumar C, et al. Global, in vivo, and site-specific phosphorylation dynamics in signaling networks. Cell. 2006;127:635–648. - PubMed
    1. Manning G, Whyte DB, Martinez R, Hunter T, Sudarsanam S. The protein kinase complement of the human genome. Science. 2002;298:1912–1934. - PubMed
    1. Manning G, Plowman GD, Hunter T, Sudarsanam S. Evolution of protein kinase signaling from yeast to man. Trends Biochem Sci. 2002;27:514–520. - PubMed
    1. Hunter T, Plowman GD. The protein kinases of budding yeast: six score and more. Trends Biochem Sci. 1997;22:18–22. - PubMed
    1. Hanks SK, Hunter T. Protein kinases 6. The eukaryotic protein kinase superfamily: kinase (catalytic) domain structure and classification. FASEB J. 1995;9:576–596. - PubMed

Publication types

MeSH terms