. 2011;6(6):e21052.
doi: 10.1371/journal.pone.0021052. Epub 2011 Jun 15.

Marital status and survival in pancreatic cancer patients: a SEER based analysis

Affiliations

Marital status and survival in pancreatic cancer patients: a SEER based analysis

Michael Baine et al. PLoS One. 2011.

Abstract

Background: Recent findings suggest that marital status affects survival in patients with different types of cancer. However, its role in the survival of patients with pancreatic ductal adenocarcinoma is unknown. In this study, we investigated whether there was an association between marital status and overall survival (OS) in patients with pancreatic ductal adenocarcinoma (PDAC).

Methods: Adult patients diagnosed with PDAC between 1998 and 2003 with known marital statuses were identified from the Surveillance, Epidemiology, and End Results registry of the National Cancer Institute. OS for these patients was plotted using the Kaplan-Meier method. Comparative risks of mortality were evaluated by using univariate and multivariate-adjusted Cox regression models.

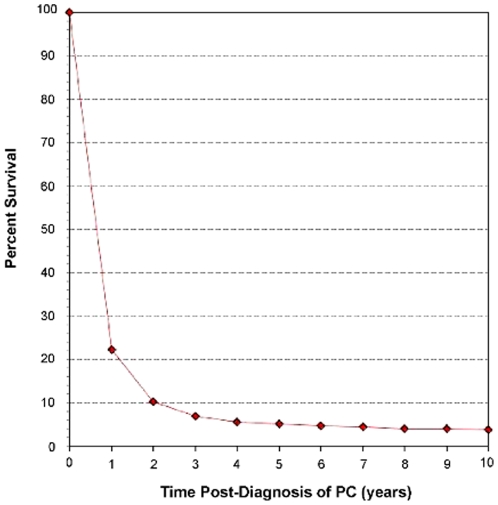
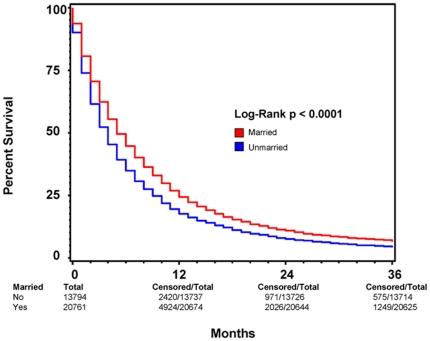
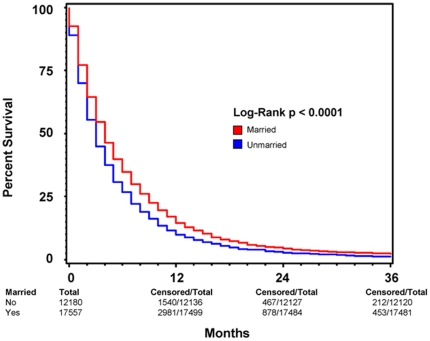
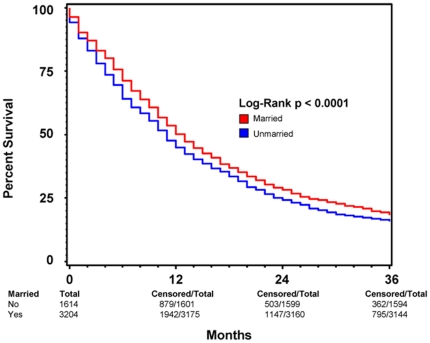
Results: Using Kaplan-Meier analysis, we found that the median overall survival of patients was 4 months and 3 months (p<0.001) for married and unmarried patients, respectively. Subgroup analysis on patients with cancer-directed surgery showed that the median survival was 16 months and 13 months (P<0.0005) for married and unmarried groups, respectively. Multivariate analysis adjusting for age, race, sex, stage, year of diagnosis, radiation therapy and cancer-directed surgery showed that patients who were married at the time of diagnosis had a significantly decreased risk of death at both 2 months (15% risk reduction) and 3 years (13% risk reduction) post diagnosis.

Conclusions: Marital status is an independent prognostic factor of both perioperative and long-term survival in patients with PDAC. This observation may suggest a suboptimally met psychosocial need among PDAC patients that is partially fulfilled by the support system provided by marriage.


Conflict of interest statement

Competing Interests: The authors have declared that no competing interests exist.

Figures

Figure 1
Figure 1. Relative Survival of Patients Diagnosed with Pancreatic Ductal Adenocarcinoma using SEER 9 data from 1988–2006.
Survival of patients with pancreatic ductal adenocarcinoma (PC) can be separated into two qualitative phases. The first phase occurs in the initial 3 years post-PC diagnosis in which patient survival declines steeply. After 3 years post-diagnosis, PC patient survival declines much more slowly in what can be considered the second phase of the PC survival curve. The nature of these phases allows for 3-year survival to be considered a reasonable endpoint for evaluation of long-term PC patient survival. Annual survival estimates were calculated using monthly intervals.
Figure 2
Figure 2. Kaplan-Meier Survival Curves Comparing Patient Marital Status.
A Kaplan-Meier survival curve comparing survival based on marital status among all patients diagnosed with pancreatic ductal adenocarcinoma (PC) between 1998 and 2003 with known marital status shows increased survival among married patients as compared to those who were non-married at the time of diagnosis. RED indicates patients who were married at the time of diagnosis and BLUE represents patients who were not married at the time of diagnosis. Total patients for each patient group, as well as total and censored patients at 12, 24, and 36 months are indicated. For each time point, “total” indicates the number of patients with ample follow-up information to determine survival at the respective time point. “Censored” indicates the number of patients who lived beyond the respective time point. This method of data representation was chosen rather than indicating at-risk patients for each time point to allow for easier interpretation of overall survival at 12, 24, and 36 months. Total patient number indicated at 0 months is equivalent to total at-risk for each patient group. For each time point, “at-risk” can be considered the number of “censored” patients from the previous time point minus the number of patients lost to follow-up between the previous and current time points. Patients lost to follow-up between time points are indicated by the respective decrease in “total” values.
Figure 3
Figure 3. Kaplan-Meier Survival Curves Comparing Patient Marital Status among patients who did not undergo cancer-directed surgery.
A Kaplan-Meier survival curve comparing survival based on marital status among all patients diagnosed with pancreatic ductal adenocarcinoma (PC) between 1998 and 2003 with known marital status who did not undergo cancer-directed surgery. This comparison illustrates that the increased survival among married patients as compared to those who were non-married at the time of diagnosis continues to be significant regardless of if the patient was not surgically treated for his or her primary tumor. RED indicates patients who were married at the time of diagnosis and BLUE represents patients who were not married at the time of diagnosis. Total patients for each patient group, as well as total and censored patients at 12, 24, and 36 months are indicated. For each time point, “total” indicates the number of patients with ample follow-up information to determine survival at the respective time point. “Censored” indicates the number of patients who lived beyond the respective time point. This method of data representation was chosen rather than indicating at-risk patients for each time point to allow for easier interpretation of overall survival at 12, 24, and 36 months. Total patient number indicated at 0 months is equivalent to total at-risk for each patient group. For each time point, “at-risk” can be considered the number of “censored” patients from the previous time point minus the number of patients lost to follow-up between the previous and current time points. Patients lost to follow-up between time points are indicated by the respective decrease in “total” values.
Figure 4
Figure 4. Kaplan-Meier Survival Curves Comparing Patient Marital Status among patients who underwent cancer-directed surgery.
A Kaplan-Meier survival curve comparing survival based on marital status among all patients diagnosed with pancreatic ductal adenocarcinoma (PC) between 1998 and 2003 with known marital status who underwent cancer-directed surgery. This comparison illustrates that the pro-survival effects of marriage hold true among patients who underwent tumor resection, a procedure that is considered the greatest prognostic factor among patients diagnosed with pancreatic cancer. RED indicates patients who were married at the time of diagnosis and BLUE represents patients who were not married at the time of diagnosis. Total patients for each patient group, as well as total and censored patients at 12, 24, and 36 months are indicated. For each time point, “total” indicates the number of patients with ample follow-up information to determine survival at the respective time point. “Censored” indicates the number of patients who lived beyond the respective time point. This method of data representation was chosen rather than indicating at-risk patients for each time point to allow for easier interpretation of overall survival at 12, 24, and 36 months. Total patient number indicated at 0 months is equivalent to total at-risk for each patient group. For each time point, “at-risk” can be considered the number of “censored” patients from the previous time point minus the number of patients lost to follow-up between the previous and current time points. Patients lost to follow-up between time points are indicated by the respective decrease in “total” values.

References

    1. The American Cancer Society: Cancer Facts and Figures 2009. http://www.cancer.org/Research/CancerFactsFigures/index. Accessed February 23, 2010.
    1. National Cancer Institute: Surveillance Epidemiology and End Results Cancer Statistics Review 1975–2006. http://seer.cancer.gov/csr/1975_2006/index.html. Accessed February 23, 2010.
    1. Kaplan GA, Salonen JT, Cohen RD, Brand RJ, Syme SL, et al. Social connections and mortality from all causes and from cardiovascular disease: prospective evidence from eastern Finland. Am J Epidemiol. 1988;128:370–80. - PubMed
    1. Kravdal O. The impact of marital status on cancer survival. Soc Sci Med. 2001;52:357–68. - PubMed
    1. Kaplan EH, Meier P. Nonparametric estimation from incomplete observations. J Amer Statist Assn. 1958;53:457–481.

Publication types