

Pedestrian injury and human behaviour: observing road-rule violations at high-incident intersections
- PMID: 21698258
- PMCID: PMC3115980
- DOI: 10.1371/journal.pone.0021063
Pedestrian injury and human behaviour: observing road-rule violations at high-incident intersections
Abstract
Background: Human behaviour is an obvious, yet under-studied factor in pedestrian injury. Behavioural interventions that address rule violations by pedestrians and motorists could potentially reduce the frequency of pedestrian injury. In this study, a method was developed to examine road-rule non-compliance by pedestrians and motorists. The purpose of the study was to examine the potential association between violations made by pedestrians and motorists at signalized intersections, and collisions between pedestrians and motor-vehicles. The underlying hypothesis is that high-incident pedestrian intersections are likely to vary with respect to their aetiology, and thus are likely to require individualized interventions--based on the type and rate of pedestrian and motorist violation.
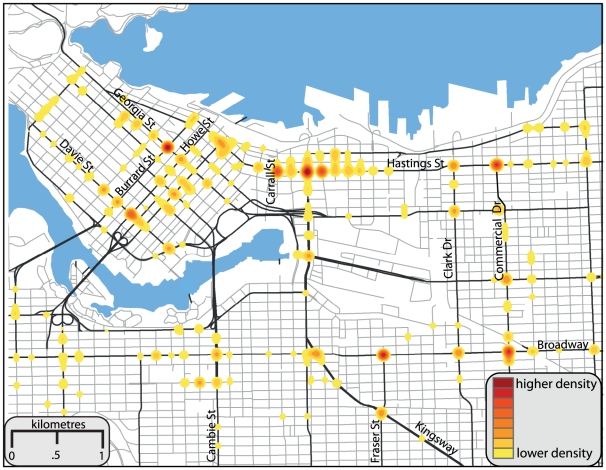
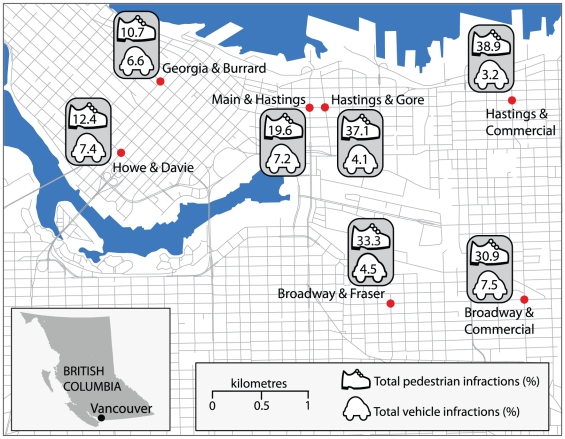
Methods: High-incident pedestrian injury intersections in Vancouver, Canada were identified using geographic information systems. Road-rule violations by pedestrians and motorists were documented at each incident hotspot by a team of observers at several different time periods during the day.
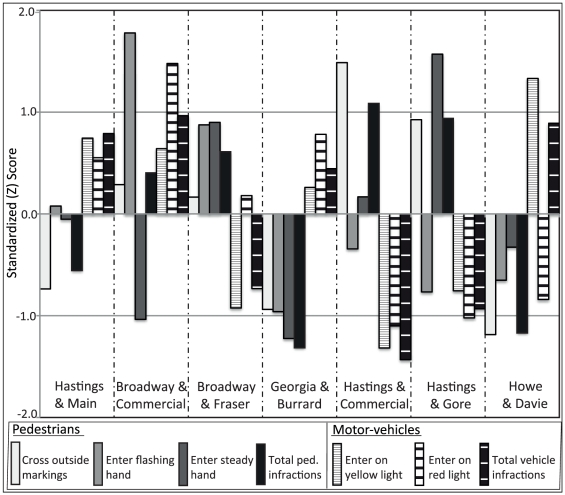
Results: Approximately 9,000 pedestrians and 18,000 vehicles were observed in total. In total for all observed intersections, over 2000 (21%) pedestrians committed one of the observed pedestrian road-crossing violations, while approximately 1000 (5.9%) drivers committed one of the observed motorist violations. Great variability in road-rule violations was observed between intersections, and also within intersections at different observation periods.
Conclusions: Both motorists and pedestrians were frequently observed committing road-rule violations at signalized intersections, suggesting a potential human behavioural contribution to pedestrian injury at the study sites. These results suggest that each intersection may have unique mechanisms that contribute to pedestrian injury, and may require targeted behavioural interventions. The method described in this study provides the basis for understanding the relationship between violations and pedestrian injury risk at urban intersections. Findings could be applied to targeted prevention campaigns designed to reduce the number of pedestrian injuries at signalized intersections.
Conflict of interest statement
Figures
References
-
- World Health Organization. Global Status Report on Road Safety: Time for Action. Geneva: WHO Department of Violence & Injury Prevention & Disability; 2009.
-
- National Highway Traffic Safety Administration. Traffic Safety Facts 2009. Washington: US Department of Transportation; 2010.
-
- Transport Canada. Canadian Motor Vehicle Collision Statistics: 2007. Ottawa: Road Safety and Motor Vehicle Regulation Directorate; 2010.
-
- Transport Canada. Canadian Motor Vehicle Traffic Collision Statistics: 2003. Ottawa: Road Safety and Motor Vehicle Regulation Directorate; 2004.
Publication types
MeSH terms
Grants and funding
LinkOut - more resources
Full Text Sources
Medical
