. 2011;6(6):e20530.
doi: 10.1371/journal.pone.0020530. Epub 2011 Jun 15.

Collective dynamics of gene expression in cell populations

Affiliations

Collective dynamics of gene expression in cell populations

Elad Stolovicki et al. PLoS One. 2011.

Abstract

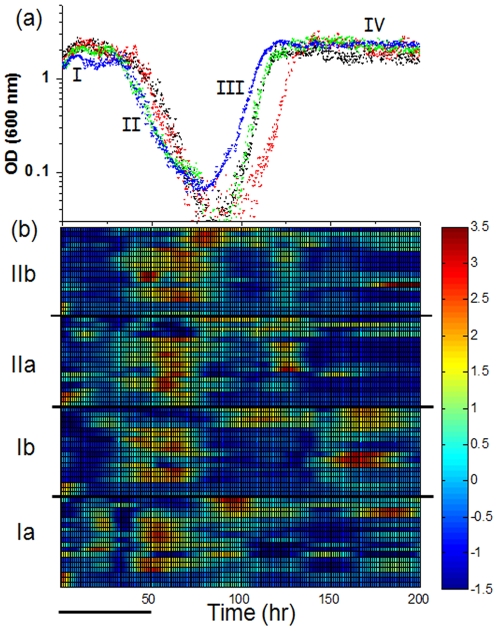
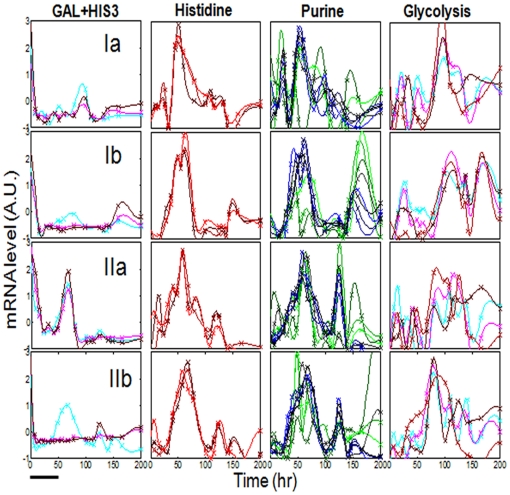
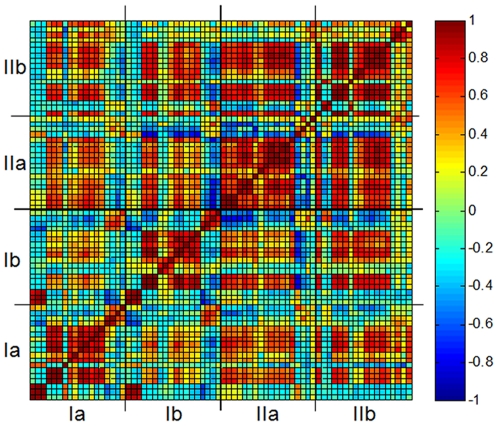
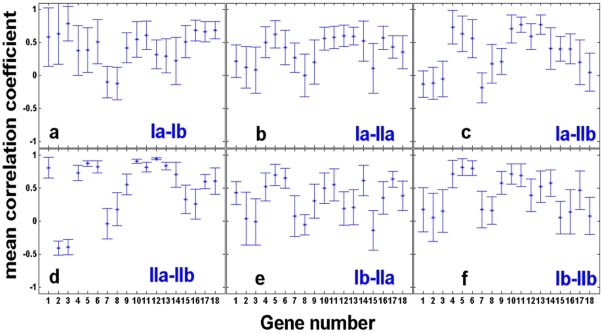
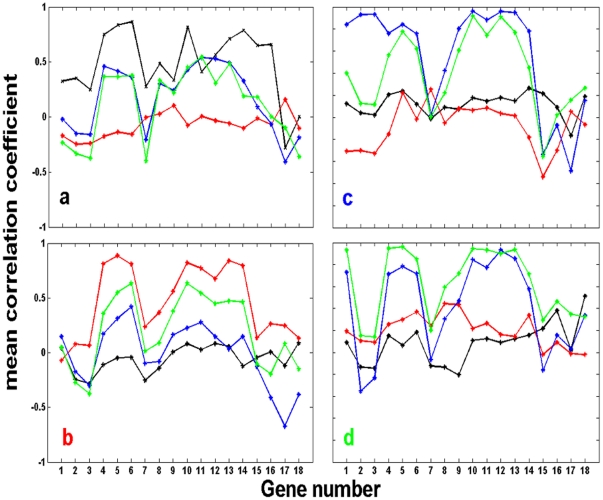
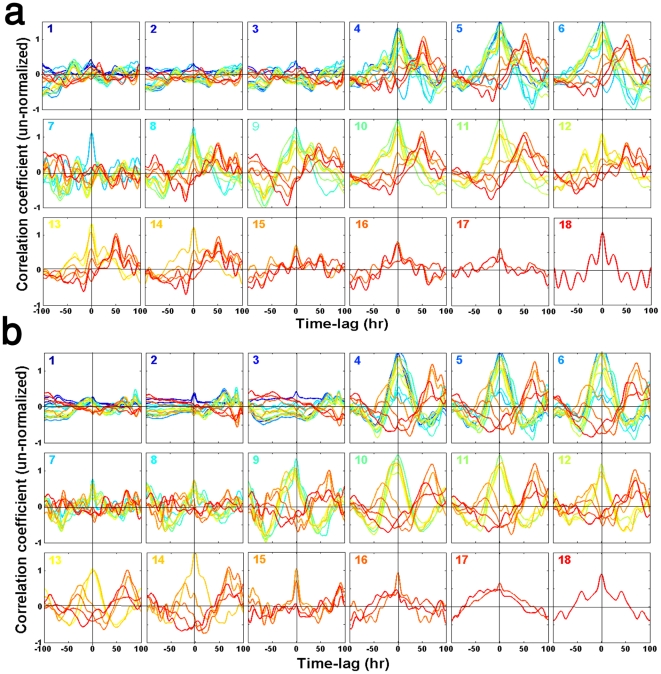
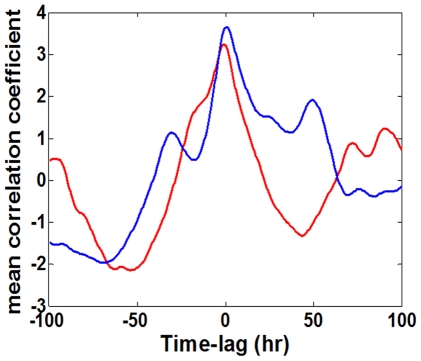
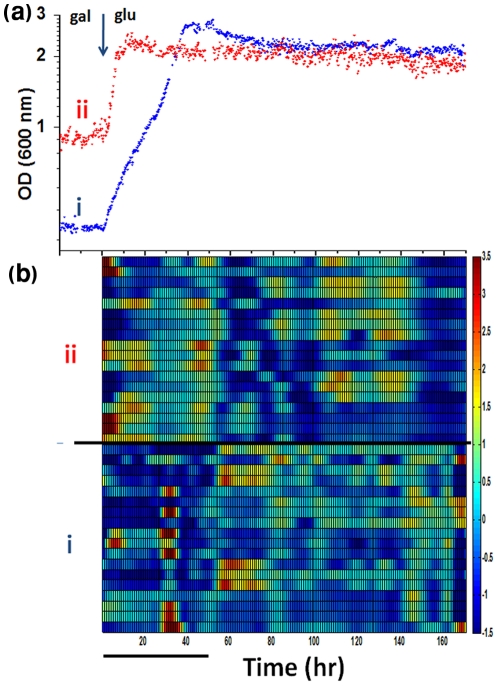
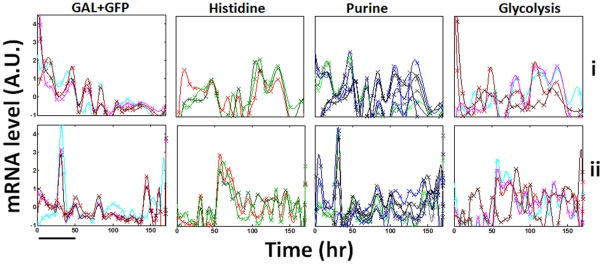
The phenotypic state of the cell is commonly thought to be determined by the set of expressed genes. However, given the apparent complexity of genetic networks, it remains open what processes stabilize a particular phenotypic state. Moreover, it is not clear how unique is the mapping between the vector of expressed genes and the cell's phenotypic state. To gain insight on these issues, we study here the expression dynamics of metabolically essential genes in twin cell populations. We show that two yeast cell populations derived from a single steady-state mother population and exhibiting a similar growth phenotype in response to an environmental challenge, displayed diverse expression patterns of essential genes. The observed diversity in the mean expression between populations could not result from stochastic cell-to-cell variability, which would be averaged out in our large cell populations. Remarkably, within a population, sets of expressed genes exhibited coherent dynamics over many generations. Thus, the emerging gene expression patterns resulted from collective population dynamics. It suggests that in a wide range of biological contexts, gene expression reflects a self-organization process coupled to population-environment dynamics.


Conflict of interest statement

Competing Interests: The authors have declared that no competing interests exist.

Figures

Figure 1
Figure 1. Phenotypes and gene expression profiles.
(a) Cell density (OD at 600 nm) as a function of time for two pairs of twin chemostats with populations of rewired cells (Ia-black and Ib-red are twin populations and so are IIa-blue and IIb-green). The histidine-lacking medium was switched from galactose to glucose as a sole carbon source at t = 0, leaving all other nutrients the same. A steady state typical of galactose metabolism was first established as a single population for each pair of twin chemostats which were decoupled prior to this medium switch into glucose. Note the y-axis logarithmic scale. Different phases of the dynamics are marked I–IV. (b) Color-coded raster plot of the mRNA expression profiles: Ia–Ib and IIa–IIb mark the same twin populations as in (a). The expression levels were measured for 18 genes belonging to different metabolic functional modules (see Methods for list of genes at the same order of appearance as in the figure for each population, starting with HIS3 as the first gene from the bottom). The measured expression levels were normalized for each gene to zero mean and unit standard deviation across its entire time profile. The color-coded profiles are cubic-spline interpolations of the measured data points shown in Fig. 2. Bar - 10 chemostat-dilution generations.
Figure 2
Figure 2. Expression profiles.
The normalized mRNA expression levels for the four populations of Fig. 1 (each row is a different population as marked). The same genes shown in Fig. 1b were separated by their functional annotation groups (different columns): GAL genes plus HIS3 (Left column, the rewired HIS3 gene is in cyan), Histidine pathway (second column from left), Purine pathway (third column from left) and Glycolysis (right column) (see Methods for the list of genes). The measured mRNA profile for each gene (relative to the value of ACT1 at that time point) were normalized as in Fig. 1b, by subtracting the mean value and dividing by the standard deviation; mean and standard deviation were computed over the entire measurement period. The lines are cubic-spline interpolations of the data points. The medium was switched from galactose to glucose at t = 0. Bar - 10 chemostat-dilution generations.
Figure 3
Figure 3. Correlation coefficient matrix.
The Pearson correlation coefficient between the mRNA time profiles shown in Fig. 1b, computed for all pair of genes in the four populations (see Methods for the definition and computation of the correlation coefficient). For each gene-pair, the correlation coefficient is the result of averaging over the entire period shown in Fig. 1. The correlation patterns are insensitive to the averaging time interval. Randomly-shuffled surrogate profiles showed zero correlation coefficients. The order of genes for each population is the same as in Fig. 1b. Near-diagonal pixels depict correlation coefficients within populations, while off-diagonal pixels are between populations (populations marked as in Fig. 1).
Figure 4
Figure 4. Bootstrap correlation coefficients across populations.
Mean and standard deviations of correlation coefficients computed between a given gene in one population and the same gene in another population. Bootstrap resampling (see Methods) was used to compute the mean and standard deviation (error bars) of the correlation coefficients for genes between populations: (a) Ia and Ib, (b) Ia and IIa, (c) Ia and IIb, (d) IIa and IIb, (e) Ib and IIa and (f) Ib and IIb. Note that (a) and (d) show the correlations between twin populations. The gene number on the x-axis is at the same order as in Fig. 1b and corresponding to the list presented in Methods.
Figure 5
Figure 5. Mean correlation coefficients between all genes within and between populations.
The bootstrap resampled data was used to compute the mean correlation coefficients between a gene (corresponding to the number on the x-axis; numbering at the same order as in Fig. 1b and according to the list presented in Methods) from a given population, and all other genes within the same population and between populations, taking errors into account (see Methods). Each figure shows the correlation coefficients between a gene from population (a) Ia, (b) Ib, (c) IIa, and (d) IIb and all the genes within and between populations according to the following colors: population Ia (black), population Ib (red), population IIa (blue), and population IIb (green).
Figure 6
Figure 6. Cross correlation functions.
The un-normalized cross correlation coefficient as a function of time-lags was computed between all the genes of populations (a) Ia and (b) Ib. The computed cubic-spline interpolation profiles for the high resolution data set of Fig. S2, was used to compute the cross correlations by direct summations (see Methods). The number in each plot is for a given gene (numbers the same order as in Fig. 1b; see Methods) which is cross-correlated with all other genes with higher numbering-label. The autocorrelation curve has the same color as the plot-number. The time-lags are measured in hrs, where 50 hrs correspond to ∼10 chemostat-dilution generations. As a control, randomly shuffled surrogate profiles showed flat correlation functions.
Figure 7
Figure 7. Mean cross-correlation coefficients.
Based on the correlation functions shown in Figs. 6a,b, the figure presents the mean cross correlations as a function of time-lags. Each curve is the result of averaging the cross-correlation coefficients (including autocorrelations) over the entire set of gene pairs, for population Ia (blue) and population Ib (red).
Figure 8
Figure 8. Phenotypes and gene expression profiles for “wild-type” cells.
(a) Cell density (OD at 600 nm) as a function of time for two repeated chemostat experiments with populations of “wild-type” cells deleted of HIS3. The histidine-containing medium was switched from galactose to glucose as a sole carbon source at t = 0, leaving all other nutrients the same. A steady state was first established in galactose prior to this medium switch into glucose. Note the y-axis logarithmic scale. (b) Color-coded raster plot of the mRNA expression profiles for the two populations (i and ii) as in (a). The expression levels were measured for 18 genes belonging to different metabolic functional modules (see Methods for list of genes at the same order of appearance as in the figure, starting with GFP under pGAL10 as the first gene from the bottom). The measured expression levels were normalized for each gene to zero mean and unit standard deviation across its entire time profile. The color-coded profiles are cubic-spline interpolations of the measured data points shown in Fig. 9. Bar - 10 chemostat-dilution generations.
Figure 9
Figure 9. Normalized expression profiles for a “wild-type” strain.
The normalized mRNA levels measured for cells deleted of the HIS3 gene and grown in the same chemostat system as the rewired cells (medium supplied with histidine). The normalization is as in Fig. 8: The measured mRNA profile for each gene (relative to the value of ACT1 at that time point) were normalized by subtracting the mean value and divided by the standard deviation; mean and standard deviation computed over the entire time period measured. (a) Population i and (b) population ii, as in Fig. 8. The medium was switched from galactose to glucose at t = 0. Bar: 10 chemostat-dilution generations.

References

    1. Booth IR. Stress and the single cell: intrapopulation diversity is a mechanism to ensure survival upon exposure to stress. Food Microbiology. 2002;71:19–30. - PubMed
    1. Kærn M, Elston TC, Blake WJ, Collins JJ. 2005;6:451–464. Stochasticity in gene expression: from theories to phenotypes. - PubMed
    1. Raser JM, O'Shea EK. Noise in gene expression: origins, consequences, and control. Science. 2005;309:2010–2013. - PMC - PubMed
    1. Brenner N, Farkash K, Braun E. Dynamics of protein distributions in cell populations. Physical Biology. 2006;3:172–182. - PubMed
    1. Eldar A, Elowitz MB. Functional roles for noise in genetic circuits. Nature. 2010;467:167–173. - PMC - PubMed

Publication types

MeSH terms

LinkOut - more resources