. 2011;6(6):e19752.
doi: 10.1371/journal.pone.0019752. Epub 2011 Jun 15.

Molecular cloning, characterization and expression analysis of two members of the Pht1 family of phosphate transporters in Glycine max

Affiliations

Molecular cloning, characterization and expression analysis of two members of the Pht1 family of phosphate transporters in Glycine max

Zhaoyun Wu et al. PLoS One. 2011.

Abstract

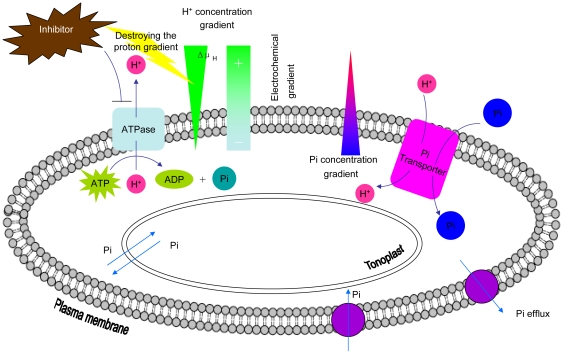
Background: Phosphorus is one of the macronutrients essential for plant growth and development. The acquisition and translocation of phosphate are pivotal processes of plant growth. In a large number of plants, phosphate uptake by roots and translocation within the plant are presumed to occur via a phosphate/proton cotransport mechanism.

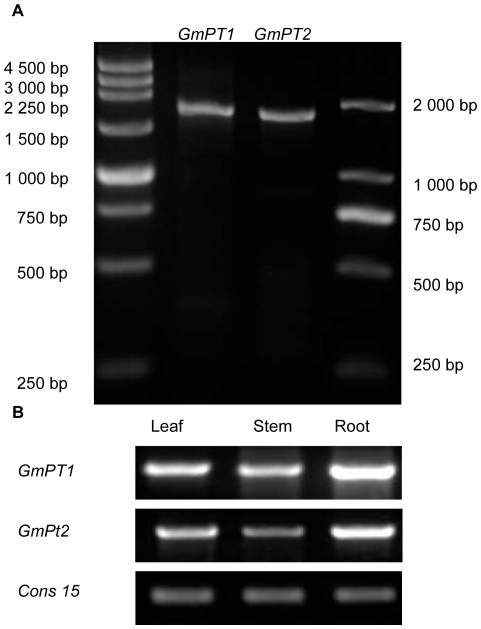
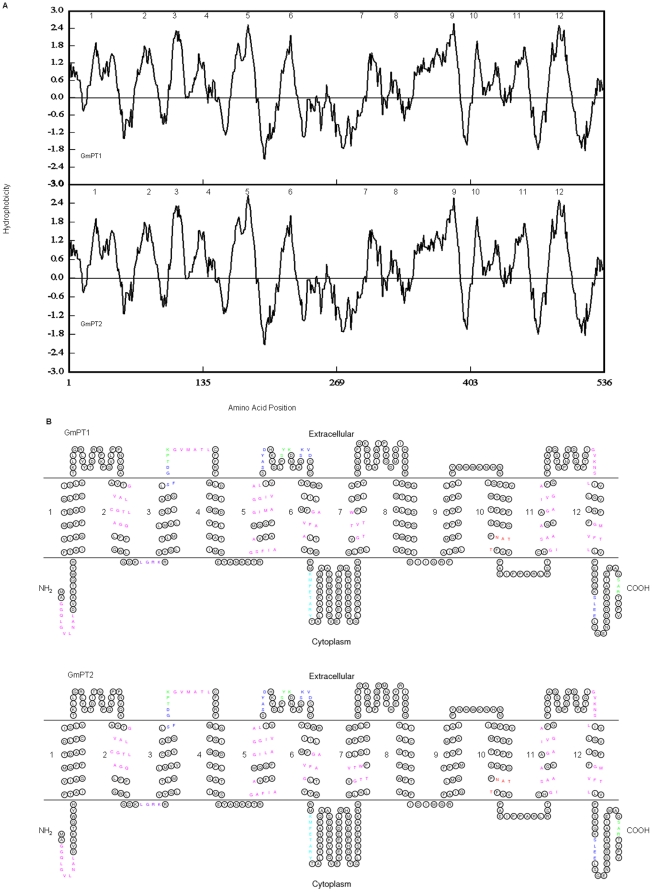
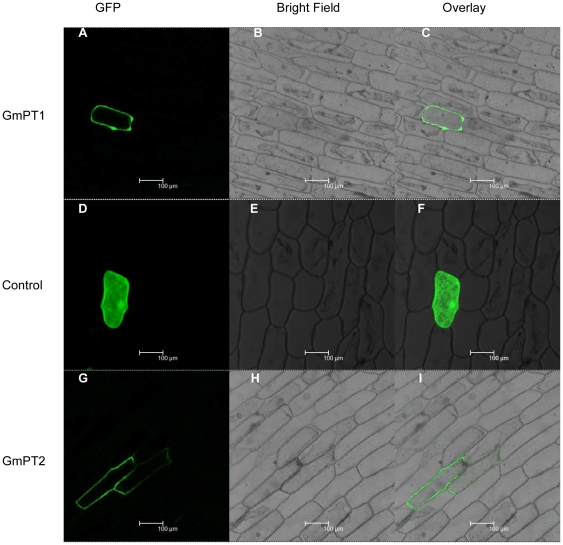
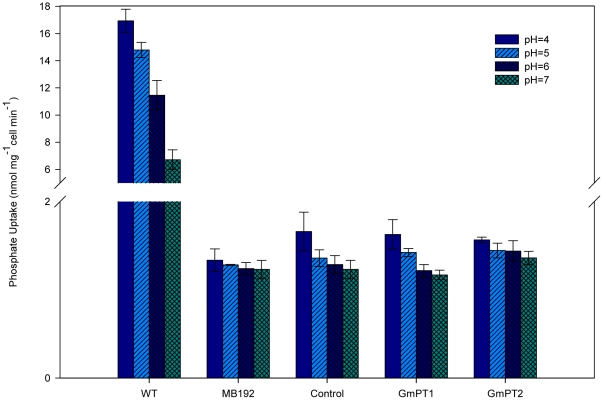
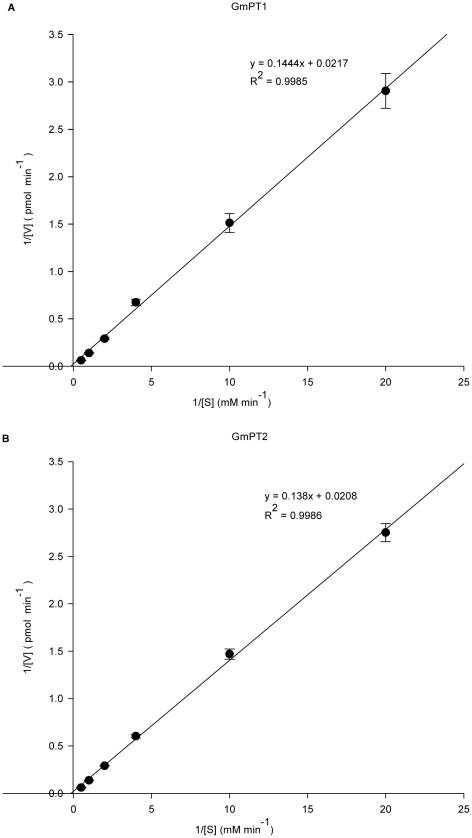
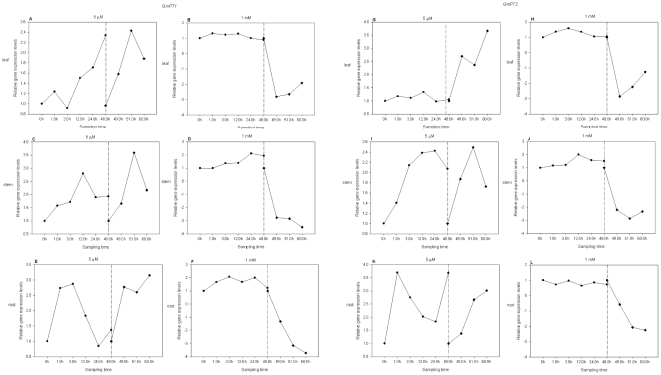
Principal findings: We cloned two cDNAs from soybean (Glycine max), GmPT1 and GmPT2, which show homology to the phosphate/proton cotransporter PHO84 from the budding yeast Saccharomyces cerevisiae. The amino acid sequence of the products predicted from GmPT1 and GmPT2 share 61% and 63% identity, respectively, with the PHO84 in amino acid sequence. The deduced structure of the encoded proteins revealed 12 membrane-spanning domains with a central hydrophilic region. The molecular mass values are ∼58.7 kDa for GmPT1 and ∼58.6 kDa for GmPT2. Transiently expressed GFP-protein fusions provide direct evidence that the two Pi transporters are located in the plasma membrane. Uptake of radioactive orthophosphate by the yeast mutant MB192 showed that GmPT1 and GmPT2 are dependent on pH and uptake is reduced by the addition of uncouplers of oxidative phosphorylation. The K(m) for phosphate uptake by GmPT1 and GmPT2 is 6.65 mM and 6.63 mM, respectively. A quantitative real time RT-PCR assay indicated that these two genes are expressed in the roots and shoots of seedlings whether they are phosphate-deficient or not. Deficiency of phosphorus caused a slight change of the expression levels of GmPT1 and GmPT2.

Conclusions: The results of our experiments show that the two phosphate transporters have low affinity and the corresponding genes are constitutively expressed. Thereby, the two phosphate transporters can perform translocation of phosphate within the plant.


Conflict of interest statement

Competing Interests: The authors have declared that no competing interests exist.

Figures

Figure 1
Figure 1. DNA gel analysis of two soybean Pi transporters.
DNA gel-blot analysis of GmPT1 and GmPT2 (A). Lanes 2 and 3 contain GmPT1 and GmPT2, respectively. The size markers are shown to the right and left of the figure. The expression profile of the two proteins in different parts of the soybean seedling (B). Seven days old soybean seedlings were used to examine the expression of GmPT1 and GmPT2 with cons15 as the control.
Figure 2
Figure 2. Predicted topology of GmPT1 and GmPT2.
Hydrophobicity profiles of GmPT1 and GmPT2 (A). Hydropathy values for a window of 14 residues were calculated by DNAMAN version 6.0.3.93 using algorithms presented by Kyte and Doolittle . Hydrophobic regions correspond to positive index numbers. The arabic numerals refer to putative membrane-spanning domains. A topological model for GmPT1 and GmPT2 (B). The membrane-spanning domains of GmPT1and GmPT2 were predicted by HMMTOP and their numbering is indicated by arabic numerals 1–12. The model was drawn with the aid of TOPO2 software (http://www.sacs.ucsf.edu/TOPO2/). Enlarged symbols indicate sites of significant structure–function importance: red, N-glycosylation; green, protein kinase C phosphorylation; blue, casein kinase II phosphorylation; cyan, tyrosine kinase phosphorylation; purple, Amidation; and magenta, N-myristoylation.
Figure 3
Figure 3. Phylogenetic relationship between GmPT1, GmPT2 and other plant and fungal Pi transporters.
Proteins (and accession numbers): PHO84 (P25297) from Saccharomyces cerevisiae; GvPT (Q00908) from Glomus versiforme; GiPT (AAL37552) from Glomus intraradices; Pht1;1 (Y07682), Pht1;2 (Y07681) Pht1;3 (O48639) and Pht2;1 (CAC15560) from Arabidopsis thaliana; StPT1 (Q43650) and StPT2 (Q41479) from Solanum tuberosum; MtPT1 (O22301) and MtPT2 (O22302) from Medicago truncatula; LePT1 (O24029) and LePT2 (O22549) from Lycopersicon esculentum; LaPT1(AAK01938) and LaPT2 (AAK38197) from Lupinus albus; NtPT1(AAF74025) from Nicotiana tabacum; OsPT1(AAN39042) and OsPT2 (AAN39043) from Oryza sativa; and GmPT1 (HQ392508) and GmPT2 (HQ392509) from Glycine max.
Figure 4
Figure 4. Subcellular localization of GmPT1/GFP and GmPT2/GFP fusion.
Images showing onion epidermal cells expressing GmPT1/GFP (A–C), empty vector (D–F) and GmPT2/GFP (G–I) fusion protein examined under fluorescent-field illumination (A, D and G) to examine GFP fluorescence; under bright-field illumination (B, E and H) and by confocal microscopy for the overlay of bright and fluorescent illumination (C, F and I). The scale bars represent 100 µM.
Figure 5
Figure 5. Inorganic phosphate (Pi) uptake as a function of external pH.
Pi uptake rates for yeast MB192 cells expressing the indicated GmPT1, GmPT2 or carrying the control vector and wild type yeast cell were determined in medium at the indicated pH value. Values shown are the mean ± SE for three independent experiments.
Figure 6
Figure 6. Lineweaver–Burk plots of GmPT1 and GmPT2.
Lineweaver–Burk plot of Pi uptake of strains MB192-GmPT1 and MB192-GmPT2 versus external Pi concentrations that were used to estimate K m.
Figure 7
Figure 7. Expression levels of GmPT1 (A–F) and GmPT2 (G–L) during Pi treatment.
The 7-day-old seedlings were grown by hydroponic culture with 0.5×Hoagland solution containing 5 µM Pi (A, C, E, G, I and K) or 1 mM Pi (B, D, F, H, J and L). Seedling tissues were harvested at 0, 1.0, 3.0, 12.0, 24.0 and 48.0 h after treatment (on the dash-dot line at the left). After treatment for 48 h, the deficient/sufficient Pi-treated seedlings were transferred to sufficient/deficient Pi in Hoagland solution, respectively. Seedling tissues were sampled at 0, 1.0 and 3.0 h after changing the nutrient solution (on the dash-dot line at the right). Leaf, A and B, G and H; stem, C and D, I and J; and root, E and F, K and L.
Figure 8
Figure 8. The Pi transporter mechanism in the plant cell.
A membrane-integral proton ATPase undirectionally extrudes protons (H+) at the expense of ATP. The proton concentration gradient and membrane potential generated constitute a proton electrochemical potential (ΔμH) across the membrane. Proton movement along the concentration and electrical gradients facilitates Pi movement by Pi transporters against a steep concentration gradient. Meanwhile, the efflux mechanism helps to maintain Pi homeostasis in the cells.

References

    1. Karandashov V, Bucher M. Symbiotic phosphate transport in arbuscular mycorrhizas. Trends Plant Sci. 2005;10:22–29. - PubMed
    1. Rausch C, Bucher M. Molecular mechanisms of phosphate transport in plants. Planta. 2002;216:23–37. - PubMed
    1. Yuan H, Liu D. Signaling components involved in plant responses to phosphate starvation. J Integr Plant Biol. 2008;50:849–859. - PubMed
    1. Schachtman DP, Reid RJ, Ayling SM. Phosphorus Uptake by Plants: From Soil to Cell. Plant Physiol. 1998;116:447–453. - PMC - PubMed
    1. Smith FW, Mudge SR, Rae AL, Glassop D. 2.Phosphate transport in plants. Plant Soil. 2003;248:71–83.

Publication types

MeSH terms