. 2011 Jun 23:11:179.
doi: 10.1186/1471-2148-11-179.

Variations on a theme: diversification of cuticular hydrocarbons in a clade of cactophilic Drosophila

Affiliations

Variations on a theme: diversification of cuticular hydrocarbons in a clade of cactophilic Drosophila

Cássia C de Oliveira et al. BMC Evol Biol. .

Abstract

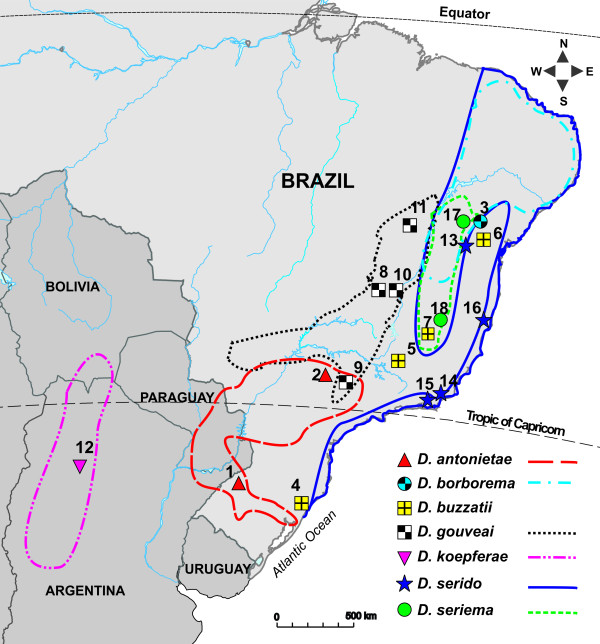
Background: We characterized variation and chemical composition of epicuticular hydrocarbons (CHCs) in the seven species of the Drosophila buzzatii cluster with gas chromatography/mass spectrometry. Despite the critical role of CHCs in providing resistance to desiccation and involvement in communication, such as courtship behavior, mating, and aggregation, few studies have investigated how CHC profiles evolve within and between species in a phylogenetic context. We analyzed quantitative differences in CHC profiles in populations of the D. buzzatii species cluster in order to assess the concordance of CHC differentiation with species divergence.

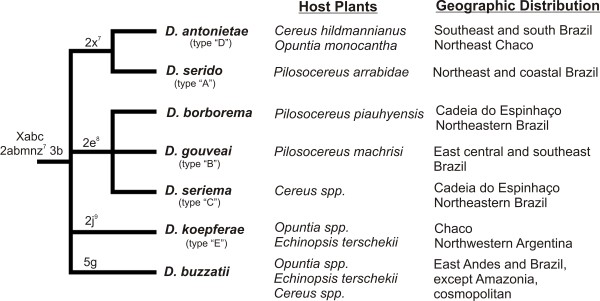
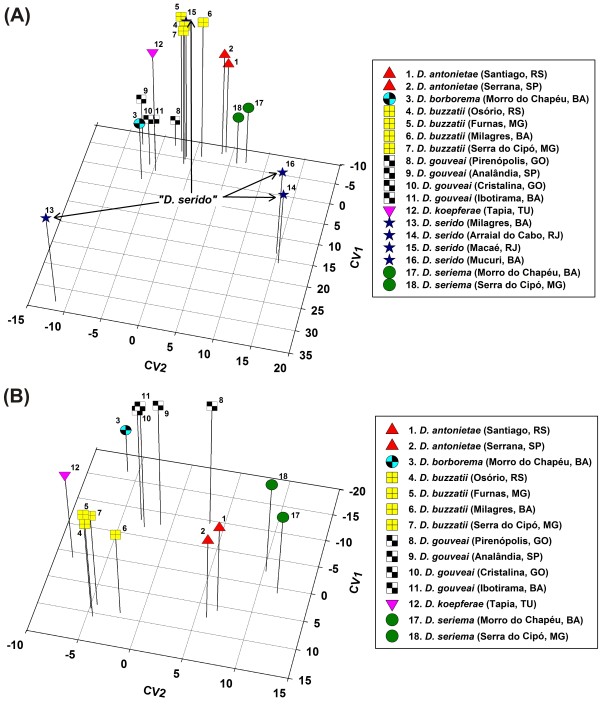
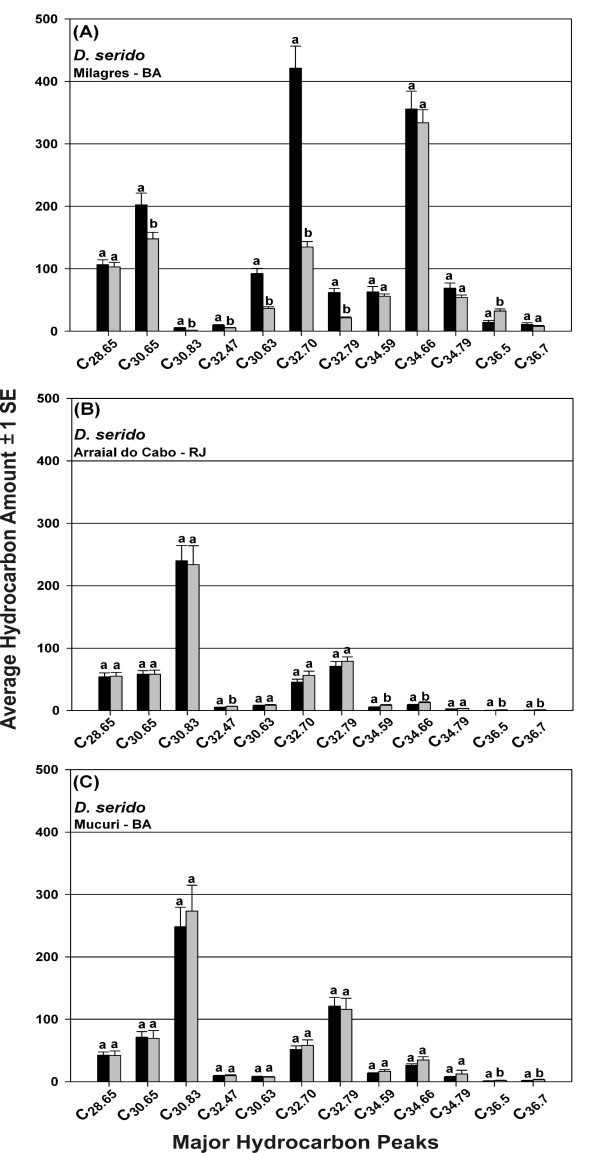
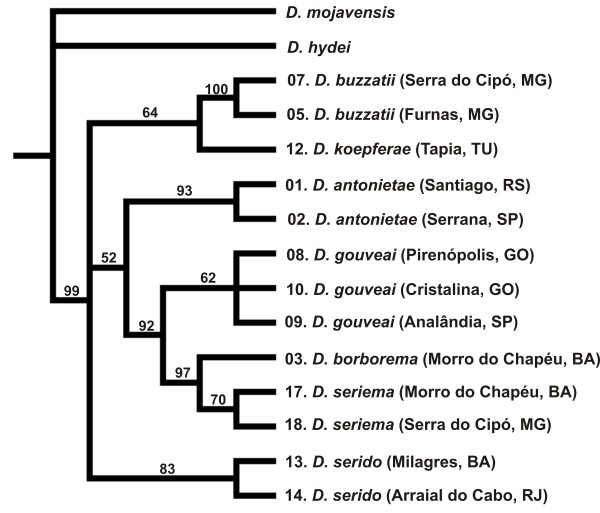
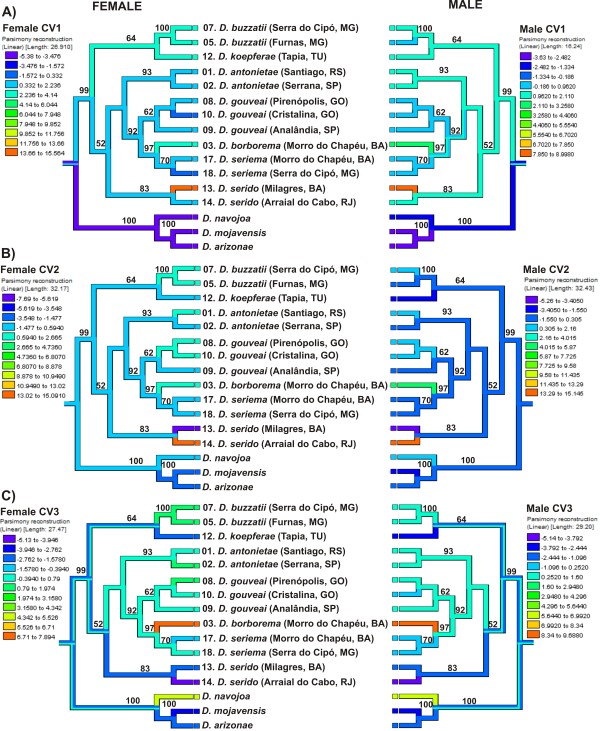
Results: Thirty-six CHC components were scored in single fly extracts with carbon chain lengths ranging from C29 to C39, including methyl-branched alkanes, n-alkenes, and alkadienes. Multivariate analysis of variance revealed that CHC amounts were significantly different among all species and canonical discriminant function (CDF) analysis resolved all species into distinct, non-overlapping groups. Significant intraspecific variation was found in different populations of D. serido suggesting that this taxon is comprised of at least two species. We summarized CHC variation using CDF analysis and mapped the first five CHC canonical variates (CVs) onto an independently derived period (per) gene + chromosome inversion + mtDNA COI gene for each sex. We found that the COI sequences were not phylogenetically informative due to introgression between some species, so only per + inversion data were used. Positive phylogenetic signal was observed mainly for CV1 when parsimony methods and the test for serial independence (TFSI) were used. These results changed when no outgroup species were included in the analysis and phylogenetic signal was then observed for female CV3 and/or CV4 and male CV4 and CV5. Finally, removal of divergent populations of D. serido significantly increased the amount of phylogenetic signal as up to four out of five CVs then displayed positive phylogenetic signal.

Conclusions: CHCs were conserved among species while quantitative differences in CHC profiles between populations and species were statistically significant. Most CHCs were species-, population-, and sex-specific. Mapping CHCs onto an independently derived phylogeny revealed that a significant portion of CHC variation was explained by species' systematic affinities indicating phylogenetic conservatism in the evolution of these hydrocarbon arrays, presumptive waterproofing compounds and courtship signals as in many other drosophilid species.


Figures

Figure 1
Figure 1
Partial view of South American map showing the geographic distribution of the species in the D. buzzatii cluster. The distribution of D. buzzatii is not marked because it is found in all areas where the other species occur. Numbers represent the localities of the eighteen populations/species used in the CHC analysis (see Table 1).
Figure 2
Figure 2
Consensus phylogeny of the D. buzzatii species cluster based on chromosomal inversions and ecological/geographical affiliations for each species. Male genitalia (aedeagus) types (A - E) for the species of the D. buzzatii cluster are labeled according to Silva and Sene [105]. D. buzzatii and D. borborema were not included in that classification because both species have aedeagi that were already well characterized and could be easily distinguishable from the other species. Chromosomal inversions, shown above the tree branches, are based on Ruiz et al. [41,53] and used together with period gene data to reconstruct the phylogeny (see Figures 5 and 6). Host plant use and geographic distributions are based on Manfrin and Sene [34], Benado et al. [106], Marín et al. [107] and Vilela [108].
Figure 3
Figure 3
A, B. Three dimensional plots of the D. buzzatii species cluster based on the first three canonical variables (CVs) obtained from 21 CHC components analyzed.A) Plot of the 18 populations/species.Altogether, the first three CVs explained 83% of the variance in the data (CV1 = 48%, CV2 = 20%, and CV3 = 15%) See Additional File 5: Table S2 for details. All Mahalanobis distances between populations were significant (P < 0.0001). Arrows denote the highly divergent D. serido populations. Numbers represent the localities of the eighteen populations used in the CHC analysis (see Table 1 and Figure 1). B) Plot of the 14 populations/species of the D. buzzatii cluster after deleting the four D. serido populations. Altogether, the first three CVs explained 85% of the variance in the data (CV1 = 46%, CV2 = 27%, and CV3 = 12%). See Additional File 6: Table S3 for details.
Figure 4
Figure 4
A - C. Epicuticular hydrocarbon amounts (average ± 1 SE) for 12 major hydrocarbon peaks of females (black) and males (gray) of 3 populations of D. serido (D. serido from Macaé is not shown). For each peak same letters represent non-significant means between females and males. Components are referred to by their equivalent chain lengths.
Figure 5
Figure 5
Strict consensus tree of six most parsimonious trees (Length = 166, CI = 0.82; RI = 0.76) of the populations/species of the D. buzzatii cluster plus two outgroup species (D. mojavensis and D. hydei) inferred from chromosomal inversions [41]and period gene data [44]. Bootstrap support (1,000 replicates and 100 random additions) is shown above the branches. Only bootstrap values above 50% are shown. The numbers before the species names represent the localities where the populations used for CHC analysis were collected. Only populations that had data for both CHC and per gene were used to reconstruct the phylogeny, i.e. 13 out of 18 populations (see Table 1).
Figure 6
Figure 6
A - C. Phylogenetic character mapping using the linear parsimony model with the first three canonical variates (CV1-CV3) based on female and male CHCs. Both sexes were analyzed together in the same CDF analysis to avoid scale effects but female and male canonical variates (CVs) were mapped separately onto the reconstructed phylogeny (see left and right trees). This phylogeny represents a most parsimonious tree (one of six trees) of the populations/species of the D. buzzatii cluster inferred from chromosomal inversions [41] and the period gene [49]. One of the outgroup taxa, D. hydei, was removed prior to the character state reconstruction because no CHC data was available for this species. The other two species of the D. mojavensis cluster, D. arizonae and D. navojoa, were added to the analysis. Bootstrap values (shown above the nodes) were based on 1,000 replicates and 100 random additions. Only bootstrap values above 50% are shown. Bootstrap support for species of D. mojavensis cluster was based on Durando et al. [58].

References

    1. Harvey PH, Pagel MD. The comparative method in evolutionary biology. New York: Oxford Univ. Press; 1991.
    1. Blomberg SP, Garland T Jr, Ives AR. Testing for phylogenetic signal in comparative data: Behavioral traits are more labile. Evolution. 2003;57(4):717–745. - PubMed
    1. Wimberger PH, de Queiroz A. In: Phylogenies and the Comparative Method in Animal Behavior. Martins EP, editor. New York: Oxford University Press; 1996. Comparing behavioral and morphological characters as indicators of phylogeny; pp. 206–233.
    1. Rendall D, Di Fiore A. Homoplasy, homology, and the perceived special status of behavior in evolution. J Hum Evol. 2007;52(5):504–521. doi: 10.1016/j.jhevol.2006.11.014. - DOI - PubMed
    1. Duckworth RA. The role of behavior in evolution: a search for mechanism. Evol Ecol. 2009;23:513–531. doi: 10.1007/s10682-008-9252-6. - DOI

Publication types

LinkOut - more resources