. 2011 Jun 24:4:19.
doi: 10.1186/1756-0381-4-19.

DADA: Degree-Aware Algorithms for Network-Based Disease Gene Prioritization

Affiliations

DADA: Degree-Aware Algorithms for Network-Based Disease Gene Prioritization

Sinan Erten et al. BioData Min. .

Abstract

Background: High-throughput molecular interaction data have been used effectively to prioritize candidate genes that are linked to a disease, based on the observation that the products of genes associated with similar diseases are likely to interact with each other heavily in a network of protein-protein interactions (PPIs). An important challenge for these applications, however, is the incomplete and noisy nature of PPI data. Information flow based methods alleviate these problems to a certain extent, by considering indirect interactions and multiplicity of paths.

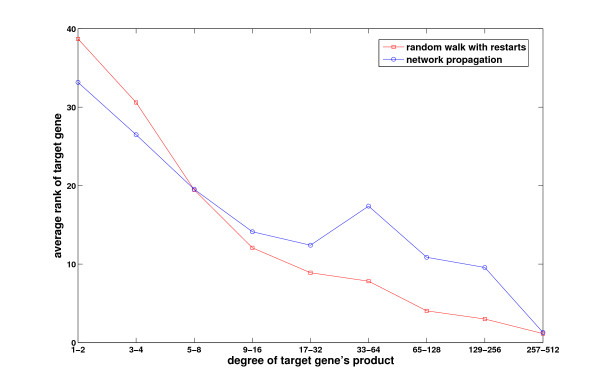
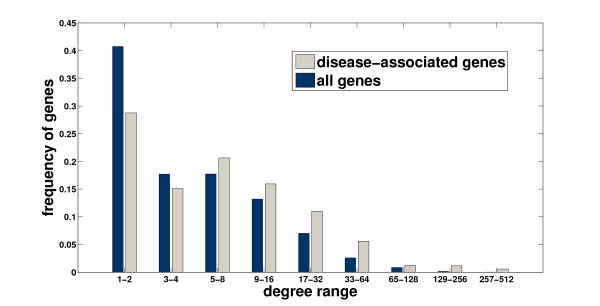
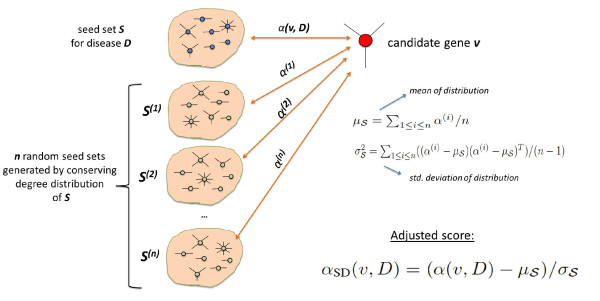
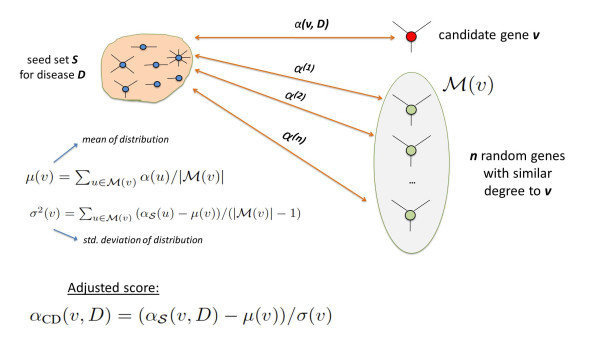
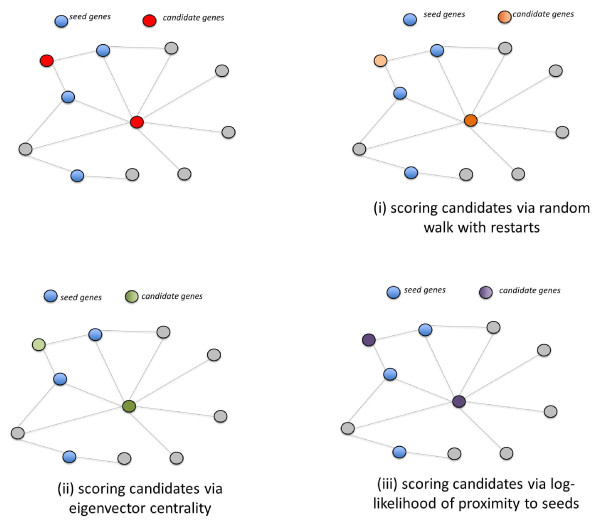
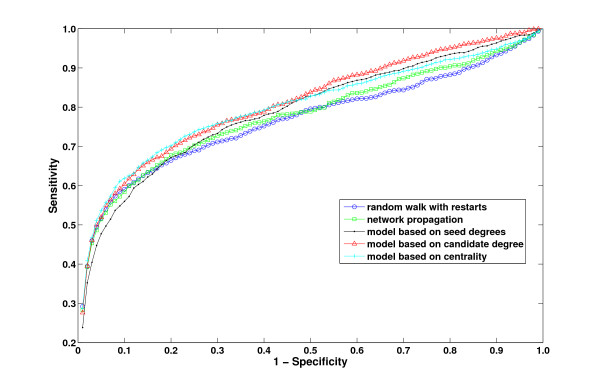
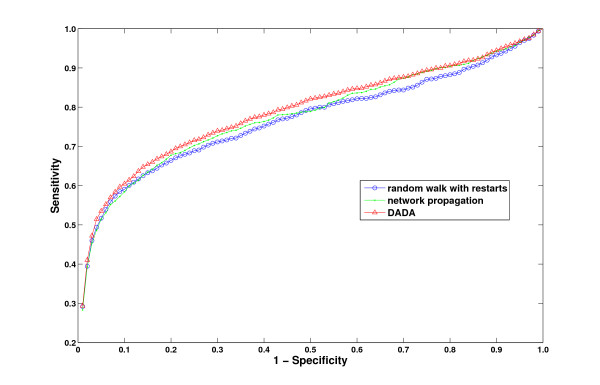
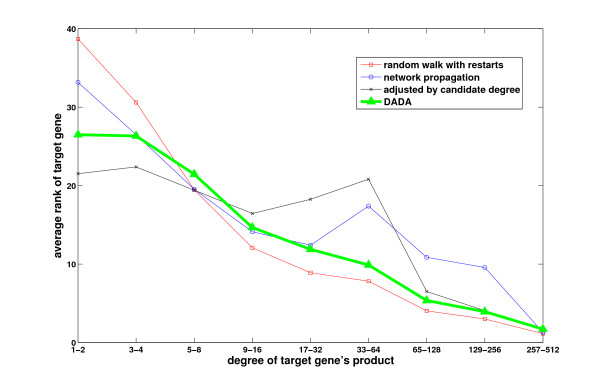
Results: We demonstrate that existing methods are likely to favor highly connected genes, making prioritization sensitive to the skewed degree distribution of PPI networks, as well as ascertainment bias in available interaction and disease association data. Motivated by this observation, we propose several statistical adjustment methods to account for the degree distribution of known disease and candidate genes, using a PPI network with associated confidence scores for interactions. We show that the proposed methods can detect loosely connected disease genes that are missed by existing approaches, however, this improvement might come at the price of more false negatives for highly connected genes. Consequently, we develop a suite called DADA, which includes different uniform prioritization methods that effectively integrate existing approaches with the proposed statistical adjustment strategies. Comprehensive experimental results on the Online Mendelian Inheritance in Man (OMIM) database show that DADA outperforms existing methods in prioritizing candidate disease genes.

Conclusions: These results demonstrate the importance of employing accurate statistical models and associated adjustment methods in network-based disease gene prioritization, as well as other network-based functional inference applications. DADA is implemented in Matlab and is freely available at http://compbio.case.edu/dada/.


Figures

Figure 1
Figure 1
The effect of connectivity of the target gene on the performance of existing methods. The performance of existing information flow based methods depends on the number of known interactions of the true disease gene. x-axis represents number of interactions, y-axis represents the average rank of true disease genes with the corresponding degree.
Figure 2
Figure 2
Histogram of the number of interactions of disease genes and all genes in the network.
Figure 3
Figure 3
Statistical adjustment based on seed degrees. First, the association score of a candidate with respect to the original seed set is computed. After generating a large number of random seed sets that represent the original set in terms of the degree distribution and size, association score of the candidate is computed using each of these random sets separately. Adjusted score of the candidate protein is then calculated as the statistical significance of the original association score, using this random population of association scores.
Figure 4
Figure 4
Statistical adjustment based on candidate degree. First, the association score of a candidate with respect to the original seed set is computed. Next, association scores of a large number of randomly selected proteins with similar degree to the candidate are computed using the original seed set. Adjusted score of the candidate protein is then calculated as the statistical significance of the original association score, using this random population of association scores.
Figure 5
Figure 5
Likelihood-ratio test using eigenvector centrality. This statistical adjustment strategy is based on the eigenvector centrality of the candidate proteins. For the given sample network, seed proteins are represented by blue nodes and the intensity of the color of the candidates is proportional to their scores computed via different methods. In (i), two candidates are scored based on their proximity to seed proteins, calculated using random walk with restarts. In (ii), candidate proteins are scored based on their eigenvalue centrality in the network (without using any seed information). Finally in (iii), scores are assigned to candidates using the log-likelihood ratio of the values computed in (i) and (ii). Although the highly connected candidate (in the center of the network) is scored higher than the loosely connected candidate in (i) and (ii), the log-likelihood ratio of both candidates is similar as illustrated in (iii) since the association scores are adjusted by the centrality of the nodes in the network.
Figure 6
Figure 6
ROC curves for the proposed statistical adjustment strategies and existing methods.
Figure 7
Figure 7
ROC curves comparing the overall performance of DADA against existing methods.
Figure 8
Figure 8
The effect of connectivity of the target gene on overall performance of DADA. Comparison of the performances of the proposed uniform prioritization method and existing methods with respect to the number of interactions of the target gene.
Figure 9
Figure 9
Case Example. Case example for the Microphthalmia disease. Products of genes associated with Microphthalmia or a similar disease are shown by green circles, where the intensity of green is proportional to the degree of similarity. The target disease gene that is left out in the experiment and correctly ranked first by our algorithm is represented by a red circle. The gene that is incorrectly ranked first for both of the existing global approaches is shown by a diamond. Other candidate genes that are prioritized are shown by yellow circles.

References

    1. Brunner HG, van Driel MA. From syndrome families to functional genomics. Nat Rev Genet. 2004;5(7):545–551. - PubMed
    1. Glazier AM, Nadeau JH, Aitman TJ. Finding Genes That Underlie Complex Traits. Science. 2002;298(5602):2345–2349. doi: 10.1126/science.1076641. http://www.sciencemag.org/cgi/content/abstract/298/5602/2345 - DOI - PubMed
    1. Lage K, Karlberg E, Storling Z, Olason P, Pedersen A, Rigina O, Hinsby A, Tumer Z, Pociot F, Tommerup N, Moreau Y, Brunak S. A human phenome-interactome network of protein complexes implicated in genetic disorders. Nat Bio. 2007;25(3):309–316. doi: 10.1038/nbt1295. - DOI - PubMed
    1. Aerts S, Lambrechts D, Maity S, Van Loo P, Coessens B, De Smet F, Tranchevent LC, De Moor B, Marynen P, Hassan B, Carmeliet P, Moreau Y. Gene prioritization through genomic data fusion. Nat Biotech. 2006;24(5):537–544. doi: 10.1038/nbt1203. - DOI - PubMed
    1. Adie E, Adams R, Evans K, Porteous D, Pickard B. SUSPECTS: enabling fast and effective prioritization of positional candidates. Bioinformatics. 2006;22(6):773–774. doi: 10.1093/bioinformatics/btk031. http://bioinformatics.oxfordjournals.org/cgi/content/abstract/22/6/773 - DOI - PubMed

LinkOut - more resources