. 2011 Sep;141(3):837-845.e1-7.
doi: 10.1053/j.gastro.2011.05.040. Epub 2011 May 27.

Tests for serum levels of trefoil factor family proteins can improve gastric cancer screening

Affiliations

Tests for serum levels of trefoil factor family proteins can improve gastric cancer screening

Susumu Aikou et al. Gastroenterology. 2011 Sep.

Abstract

Background & aims: Improving methods for early detection of gastric cancer could reduce mortality. Measurements of serum pepsinogen levels have been used for screening in Japan without satisfactory levels of sensitivity or specificity. Trefoil factor family (TFF) proteins (TFF1, TFF2, and TFF3) are small and stable molecules secreted by the mammalian gastrointestinal tract. Foveolar hyperplasia, spasmolytic polypeptide (TFF2)-expressing metaplasia, and intestinal metaplasia are histologic changes observed in patients with atrophic gastritis; they express TFF1, TFF2, and TFF3, respectively. We investigated whether serum levels of TFF can be used as markers for gastric cancer screening.

Methods: Serum was collected from 183 patients with gastric cancer and 280 healthy individuals without cancer. Serum levels of anti-Helicobacter pylori immunoglobulin G, pepsinogen I, pepsinogen II, TFF1, TFF2, and TFF3 were measured by enzyme-linked immunosorbent assay and associated with gastric cancer.

Results: Using a cutoff of 3.6 ng/mL, the level of TFF3 was significantly increased in serum samples from patients with cancer (odds ratio, 18.1; 95% confidence interval, 11.2-29.2); using this test, patients with cancer were identified with 80.9% sensitivity and 81.0% specificity. The test for TFF3 had a significantly higher odds ratio than that for pepsinogen. A test for the combination of TFF3 and pepsinogen had better results than the test for only pepsinogen.

Conclusions: Serum levels of TFF3 are a better marker of gastric cancer than pepsinogen; a test for the combined levels of serum pepsinogen and TFF3 could improve gastric cancer screening.


Conflict of interest statement

Conflict of interest

Yasukazu Ohmoto is an employee of Otsuka Pharmaceutical Company, which is making anti-cancer drugs.

Figures

Fig. 1
Fig. 1
Serum TFFs levels were measured by ELISA. Serum TFFs levels in gastric cancer patients are significantly higher than in control group without H. pylori infection. Serum TFFs levels in control group with H. pylori infection are also significantly higher than in control group without H. pylori infection. Serum TFF2 and TFF3 levels in gastric cancer patients are also higher than in control group with H. pylori infection.
Fig. 2
Fig. 2
ROC curves for serum TFFs level to distinguish people with H. pylori infection. The area under curve of TFF1, TFF2 and TFF3 are 0.952, 0.811 and 0.587. TFF1 correlates very well with H. pylori infectious status. (A) ROC curves for serum TFFs level to distinguish patients with gastric cancer. The area under curve of TFF1, TFF2, TFF3 and pepsinogen I/II ratio are 0.835, 0.735, 0.886 and 0.756 for all the analyzed patients. The PPV of TFF1, TFF2, TFF3 and pepsinogen I/II ratio are 0.648, 0.665, 0.709, and 0.608. The NPV of them are 0.918, 0.810, 0.895, and 0.874. (B) For H. pylori negative patients, all the markers shows good ROC curves. The PPV of TFF1, TFF2, TFF3 and pepsinogen I/II ratio are 0.919, 0.843, 0.784, and 0.814. The NPV of them are 0.934, 0.865, 0.935 and 0.886. (C) However, for H. pylori positive patients, only TFF3 shows good ROC curve. The PPV of TFF1, TFF2, TFF3 and pepsinogen I/II ratio are 0.618, 0.812, 0.776, and 0.606. The NPV of them are 0.68, 0.587, 0.805, and 0.509. (D)
Fig. 2
Fig. 2
ROC curves for serum TFFs level to distinguish people with H. pylori infection. The area under curve of TFF1, TFF2 and TFF3 are 0.952, 0.811 and 0.587. TFF1 correlates very well with H. pylori infectious status. (A) ROC curves for serum TFFs level to distinguish patients with gastric cancer. The area under curve of TFF1, TFF2, TFF3 and pepsinogen I/II ratio are 0.835, 0.735, 0.886 and 0.756 for all the analyzed patients. The PPV of TFF1, TFF2, TFF3 and pepsinogen I/II ratio are 0.648, 0.665, 0.709, and 0.608. The NPV of them are 0.918, 0.810, 0.895, and 0.874. (B) For H. pylori negative patients, all the markers shows good ROC curves. The PPV of TFF1, TFF2, TFF3 and pepsinogen I/II ratio are 0.919, 0.843, 0.784, and 0.814. The NPV of them are 0.934, 0.865, 0.935 and 0.886. (C) However, for H. pylori positive patients, only TFF3 shows good ROC curve. The PPV of TFF1, TFF2, TFF3 and pepsinogen I/II ratio are 0.618, 0.812, 0.776, and 0.606. The NPV of them are 0.68, 0.587, 0.805, and 0.509. (D)
Fig. 3
Fig. 3
Sensitivity, specificity and odds ratio of TFFs, pepsinogen test and anti-H. pylori IgG for detecting gastric cancer. TFF1 and TFF3 show significantly higher odds ratio than pepsinogen test.
Fig. 4
Fig. 4
The ROC curves of PGI/II, TFF3, and TFF3+PGI/II are shown. TFF3+PGI/II can provide the best gastric cancer screening marker among them.
Fig. 5
Fig. 5
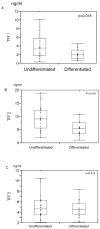
The serum TFF1 and TFF2 of the patients with undifferentiated cancer was significantly higher than the patients with differentiated cancer (TFF1: p=0.018, TFF2: p=0.016). The serum TFF3 levels of the patients with differentiated gastric cancer and with undifferentiated gastric caner did not differ significantly (p=0.312).
Fig. 6
Fig. 6
Serum TFF levels before and after gastrectomy. Serum TFF1 and TFF2 levels were significantly decreased after operation for gastric cancer. There was no significant change in serum TFF3 level between before and after operation.

References

    1. Pisani P, Parkin DM, Bray F, et al. Estimates of the worldwide mortality from 25 cancers in 1990. Int J Cancer. 1999;83:18–29. - PubMed
    1. Hamashima C, Shibuya D, Yamazaki H, et al. The Japanese guidelines for gastric cancer screening. Jpn J Clin Oncol. 2008;38:259–67. - PubMed
    1. Miki K, Ichinose M, Kakei N, et al. The clinical application of the serum pepsinogen I and II levels as a mass screening method for gastric cancer. Adv Exp Med Biol. 1995;362:139–43. - PubMed
    1. Plaut AG. Trefoil peptides in the defense of the gastrointestinal tract. N Engl J Med. 1997;336:506–7. - PubMed
    1. Ribieras S, Tomasetto C, Rio MC. The pS2/TFF1 trefoil factor, from basic research to clinical applications. Biochim Biophys Acta. 1998;1378:F61–77. - PubMed

Publication types