Comparative Study
. 2011 Nov;8(11):1758-65.
doi: 10.1016/j.hrthm.2011.05.007. Epub 2011 May 14.

Time- and frequency-domain analyses of atrial fibrillation activation rate: the optical mapping reference

Affiliations
Comparative Study

Time- and frequency-domain analyses of atrial fibrillation activation rate: the optical mapping reference

Omer Berenfeld et al. Heart Rhythm. 2011 Nov.

Abstract

Background: Time- and frequency-domain estimates of activation rate have been proposed to guide atrial fibrillation (AF) ablation in patients, but their electrophysiological correlates are unclear.

Objective: This study sought to examine the relative correlation of average electrical cycle length (CL) and dominant frequency (DF) during AF with reference optical mapping measures.

Methods: Eight sheep hearts were Langendorff-perfused and superfused with oxygenated Tyrode solution inside a tank representing the human thorax. Optical mapping (DI-4-ANEPPS) of 4 × 4 cm2 in the left atrium was performed at 0.5 mm/pixel and 600 fps. A 20-pole catheter was placed in the optical field of view to acquire 1.2-kHz unipolar recordings by the EnSite NavX System (ENS; St. Jude Medical, St. Paul, MN) optimized for CL and DF calculation. During AF, 5-second-long simultaneous optical and electrical signals were analyzed for CL and DF.

Results: During pacing, DF measurements had fewer false results than CL (6.6% to 2.5% vs. 21.5% to 4.4% depending on filtering, P <.001). During AF in regions showing periodic waves on both sides of the catheter optical 1,000/CL versus DF correlation showed 95% confidence identity and was better than unipolar measurements in the ENS (adjusted R(2): 0.58879 vs. 0.12902; P < 10(-6)). DFs of unipolar signals correlated better than CLs with DFs of optical signals. Similarly, bipolar DF correlation with optical DF was not different from identity (P >.157), but the bipolar CL showed smaller identity with the optical CL (P <.0004).

Conclusion: DF values of unipolar and bipolar signals correlate with those of optical signals better than CL values for the respective signals.


Figures

Figure 1
Figure 1
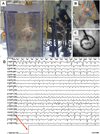
The electro-optical experimental setting. A) A front view of the isolated Langendorff-perfused sheep heart inside the 30-L transparent Plexiglas tank. A CCD camera is seen on the right side B) A left view of the isolated heart through the transparent Plexiglas wall. The catheter is seen to be in contact with the LA epicardium (blue arrow). Two sample electric-field generating electrodes are marked on the tank wall (red arrows). C) A 20-electrode circular catheter is seen through the CCD camera to be stitched onto the LA free wall/appendage (LAFW/LAA; Ant, anterior; Post, posterior). D) A sample snapshot of the ENS screen showing 20 unipolars recorded during AF. The bottom trace is a digital input with a step indicating the instant of the beginning of a movie recording (red arrow).
Figure 2
Figure 2
ENS Diagnostic Landmarking module analysis for CFE-mean (average CL) and DF from 158 unipolar recordings using the 20-pole catheter (N=8, 5-second long episode per heart). A) Histograms show the distributions of the CFE-mean and the DF for the L50 (top) and L150 (bottom) filtering modes during pacing at 200 ms (5 Hz). The settings in the Diagnostic Landmarking module were optimized to maximize the number of pacing rate detections by the CFE-mean and DF. B) Cumulative correlation of the ENS 1000/CFE-mean (1000/CL) and DF during 8 episodes of AF for the L50 (top) and L150 (bottom) filtering modes.
Figure 3
Figure 3
A) Activation maps showing sequential waves propagating in the direction of the white arrow and crossing the circular catheter(superimposed gray shade) near electrodes 11 and 12 in this animal. Sites 1 and 2 in the left-most panel indicate pixels used for optical data analysis and correlation with electrodes signals. B) Sample comparison between simultaneous nearby optical (top and bottom) and electrical (middle; u, unipolars; b, bipolars) time and frequency analysis. Left: sample 260 msec episode showing STP during AF. Red circles: Activation times of optical signals. Red and blue triangles: Activation times of the unipolars. Black triangles: Activation times of the corresponding bipolars. Green line: Activation times of pixel 1 (top). Purple line: Activation time of pixel 2 (bottom). Right: corresponding power spectra of 5-second long signals including the episodes shown on left. Circles and triangles: Dominant frequency peaks (blue triangles are overlapped by red triangles).
Figure 4
Figure 4
Correlations between 1000/CL and DF values for 20 single pixel recordings (panel A, N=5) and 30 unipolars recorded by the ENS and analyzed by the CFE-mean (panel B, N=5). The data points in the two panels were obtained in the same atrial region and during same 6 AF episodes. See Methods/Statistics for line colors legend.
Figure 5
Figure 5
Correlations between unipolar (ENS) and optical signals (N=5, during 6 movies). A) Correlation of ENS CFE-mean and optical CL for L50 (top, n=40) and L150 (bottom, n=38). B) Correlation of ENS DF and optical DF for L50 (top, n=28) and L150 (bottom, n=28). See Methods/Statistics for line colors legend.
Figure 6
Figure 6
Correlations between bipolar and optical signals. A) Correlation of CL for L50 (top, n=24) and L150 (bottom, n=24). B) Correlation of DF for L50 (top, n=32) and L150 (bottom, n=32). See Methods/Statistics for line color legends.
Figure 7
Figure 7
Comparisons of dispersions of the CLs and DFs between electrical and optical modalities. A) Values of slopes for the 4 different correlation graphs shown in Figure 5 for unipolars (ENS CFE-mean and DF) vs. optical data. B) Values of slopes for the 4 different correlation graphs shown in Figure 6 for bipolars (CL and DF) vs. optical data. Horizontal red line: Desired identity slope value of 1. X-axis labels refer to either CL (gray bars) or DF (white bars) with the respective filtering mode (L50 or L150).

Comment in

References

    1. Haissaguerre M, Sanders P, Hocini M, et al. Changes in atrial fibrillation cycle length and inducibility during catheter ablation and their relation to outcome. Circulation. 2004;109(24):3007–3013. - PubMed
    1. Takahashi Y, Jais P, Hocini M, et al. Shortening of fibrillatory cycle length in the pulmonary vein during vagal excitation. J Am Coll Cardiol. 2006;47(4):774–780. - PubMed
    1. Sanders P, Berenfeld O, Hocini M, et al. Spectral analysis identifies sites of high-frequency activity maintaining atrial fibrillation in humans. Circulation. 2005;112(6):789–797. - PubMed
    1. Atienza F, Almendral J, Jalife J, et al. Real-time dominant frequency mapping and ablation of dominant frequency sites in atrial fibrillation with left-to-right frequency gradients predicts long-term maintenance of sinus rhythm. Heart Rhythm. 2009;6(1):33–40. - PMC - PubMed
    1. Nademanee K, McKenzie J, Kosar E, et al. A new approach for catheter ablation of atrial fibrillation: Mapping of the electrophysiologic substrate. Journal of the American College of Cardiology. 2004;43(11):2044–2053. - PubMed

Publication types