

3D-Image analysis platform monitoring relocation of pluripotency genes during reprogramming
- PMID: 21700670
- PMCID: PMC3177216
- DOI: 10.1093/nar/gkr486
3D-Image analysis platform monitoring relocation of pluripotency genes during reprogramming
Abstract
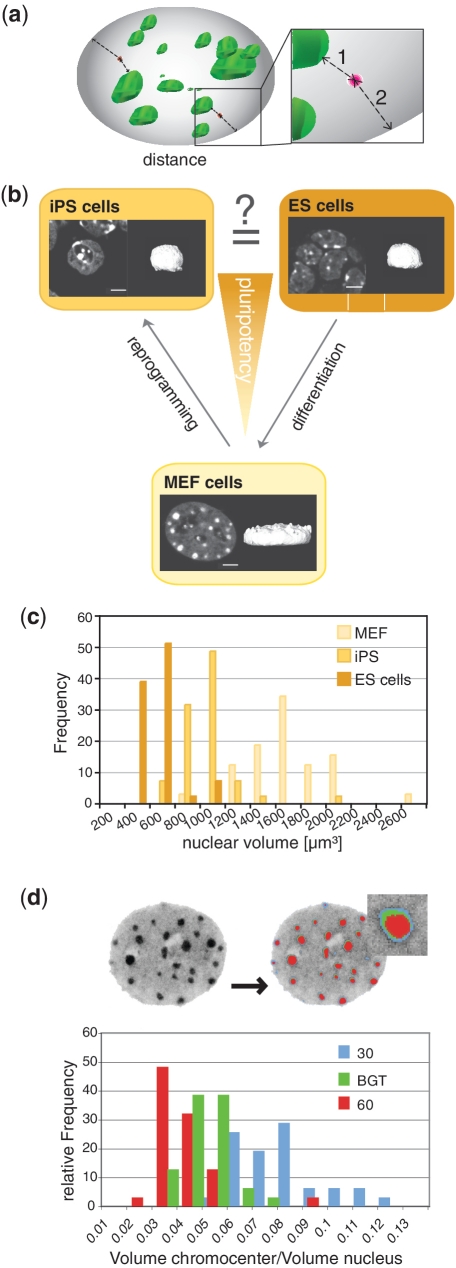
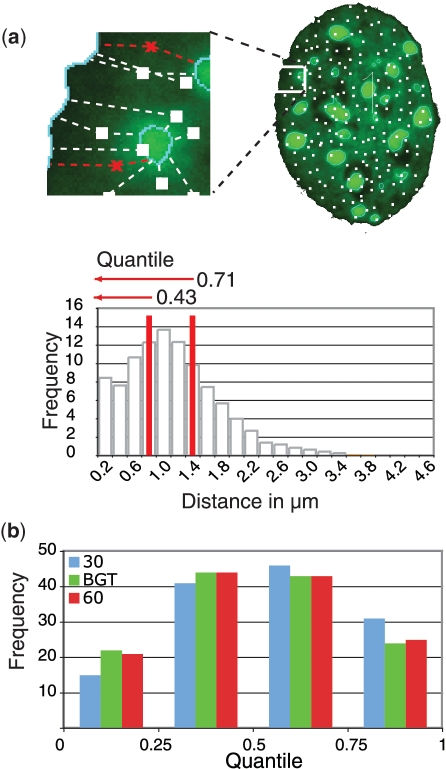
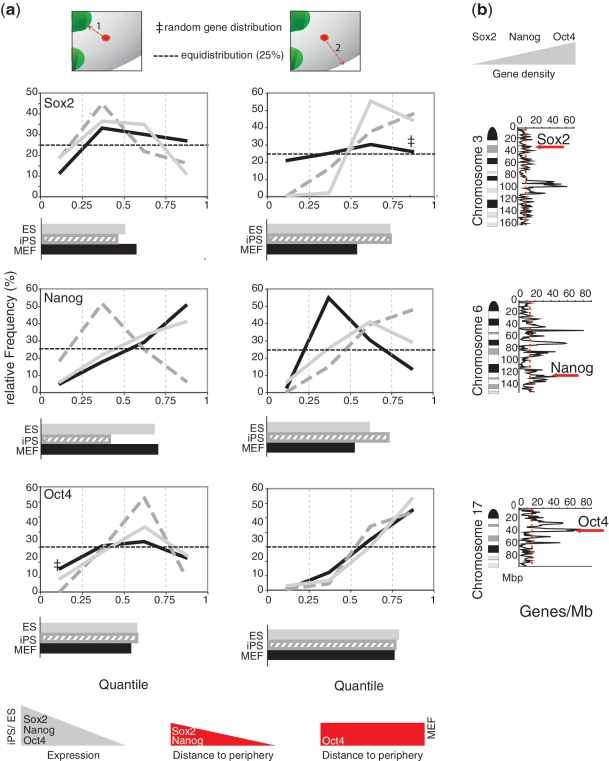
Nuclear organization of chromatin is an important level of genome regulation with positional changes of genes occurring during reprogramming. Inherent variability of biological specimens, wide variety of sample preparation and imaging conditions, though pose significant challenges to data analysis and comparison. Here, we describe the development of a computational image analysis toolbox overcoming biological variability hurdles by a novel single cell randomizing normalization. We performed a comparative analysis of the relationship between spatial positioning of pluripotency genes with their genomic activity and determined the degree of similarity between fibroblasts, induced pluripotent stem cells and embryonic stem cells. Our analysis revealed a preferred positioning of actively transcribed Sox2, Oct4 and Nanog away from the nuclear periphery, but not from pericentric heterochromatin. Moreover, in the silent state, we found no common nuclear localization for any of the genes. Our results suggest that the surrounding gene density hinders relocation from an internal nuclear position. Altogether, our data do not support the hypothesis that the nuclear periphery acts as a general transcriptional silencer, rather suggesting that internal nuclear localization is compatible with expression in pluripotent cells but not sufficient for expression in mouse embryonic fibroblasts. Thus, our computational approach enables comparative analysis of topological relationships in spite of stark morphological variability typical of biological data sets.
Figures
Similar articles
-
Reprogramming of mouse fibroblasts into induced pluripotent stem cells with Nanog.Biochem Biophys Res Commun. 2013 Feb 15;431(3):444-9. doi: 10.1016/j.bbrc.2012.12.149. Epub 2013 Jan 16. Biochem Biophys Res Commun. 2013. PMID: 23333380
-
Positions of pluripotency genes and hepatocyte-specific genes in the nucleus before and after mouse ES cell differentiation.Genet Mol Res. 2014 Mar 24;13(1):1979-88. doi: 10.4238/2014.March.24.2. Genet Mol Res. 2014. PMID: 24737423
-
High throughput sequencing identifies an imprinted gene, Grb10, associated with the pluripotency state in nuclear transfer embryonic stem cells.Oncotarget. 2017 Jul 18;8(29):47344-47355. doi: 10.18632/oncotarget.17185. Oncotarget. 2017. PMID: 28476045 Free PMC article.
-
Transcriptional and epigenetic mechanisms of cellular reprogramming to induced pluripotency.Epigenomics. 2016 Aug;8(8):1131-49. doi: 10.2217/epi-2016-0032. Epub 2016 Jul 15. Epigenomics. 2016. PMID: 27419933 Free PMC article. Review.
-
Concise review: Induced pluripotent stem cells versus embryonic stem cells: close enough or yet too far apart?Stem Cells. 2012 Jan;30(1):33-41. doi: 10.1002/stem.700. Stem Cells. 2012. PMID: 22213481 Review.
Cited by
-
Developmental conservation of microRNA gene localization at the nuclear periphery.PLoS One. 2019 Nov 4;14(11):e0223759. doi: 10.1371/journal.pone.0223759. eCollection 2019. PLoS One. 2019. PMID: 31682635 Free PMC article.
-
Spectral imaging to visualize higher-order genomic organization.Nucleus. 2016 May 3;7(3):325-38. doi: 10.1080/19491034.2016.1187344. Epub 2016 May 11. Nucleus. 2016. PMID: 27167405 Free PMC article.
-
Characterization and dynamics of pericentromere-associated domains in mice.Genome Res. 2015 Jul;25(7):958-69. doi: 10.1101/gr.186643.114. Epub 2015 Apr 16. Genome Res. 2015. PMID: 25883320 Free PMC article.
-
The Nuclear Option: Evidence Implicating the Cell Nucleus in Mechanotransduction.J Biomech Eng. 2017 Feb 1;139(2):0210061-02100616. doi: 10.1115/1.4035350. J Biomech Eng. 2017. PMID: 27918797 Free PMC article. Review.
-
A new model of sperm nuclear architecture following assessment of the organization of centromeres and telomeres in three-dimensions.Sci Rep. 2017 Jan 31;7:41585. doi: 10.1038/srep41585. Sci Rep. 2017. PMID: 28139771 Free PMC article.
References
-
- Lanctot C, Cheutin T, Cremer M, Cavalli G, Cremer T. Dynamic genome architecture in the nuclear space: regulation of gene expression in three dimensions. Nat. Rev. Genet. 2007;8:104–115. - PubMed
-
- Brown KE, Guest SS, Smale ST, Hahm K, Merkenschlager M, Fisher AG. Association of transcriptionally silent genes with Ikaros complexes at centromeric heterochromatin. Cell. 1997;91:845–854. - PubMed
-
- Reddy KL, Zullo JM, Bertolino E, Singh H. Transcriptional repression mediated by repositioning of genes to the nuclear lamina. Nature. 2008;452:243–247. - PubMed
Publication types
MeSH terms
LinkOut - more resources
Full Text Sources
Molecular Biology Databases
Research Materials
